Slavic vs German Householder Income Ages 45 - 64 years
COMPARE
Slavic
German
Householder Income Ages 45 - 64 years
Householder Income Ages 45 - 64 years Comparison
Slavs
Germans
$102,629
HOUSEHOLDER INCOME AGES 45 - 64 YEARS
76.1/ 100
METRIC RATING
158th/ 347
METRIC RANK
$100,224
HOUSEHOLDER INCOME AGES 45 - 64 YEARS
48.8/ 100
METRIC RATING
175th/ 347
METRIC RANK
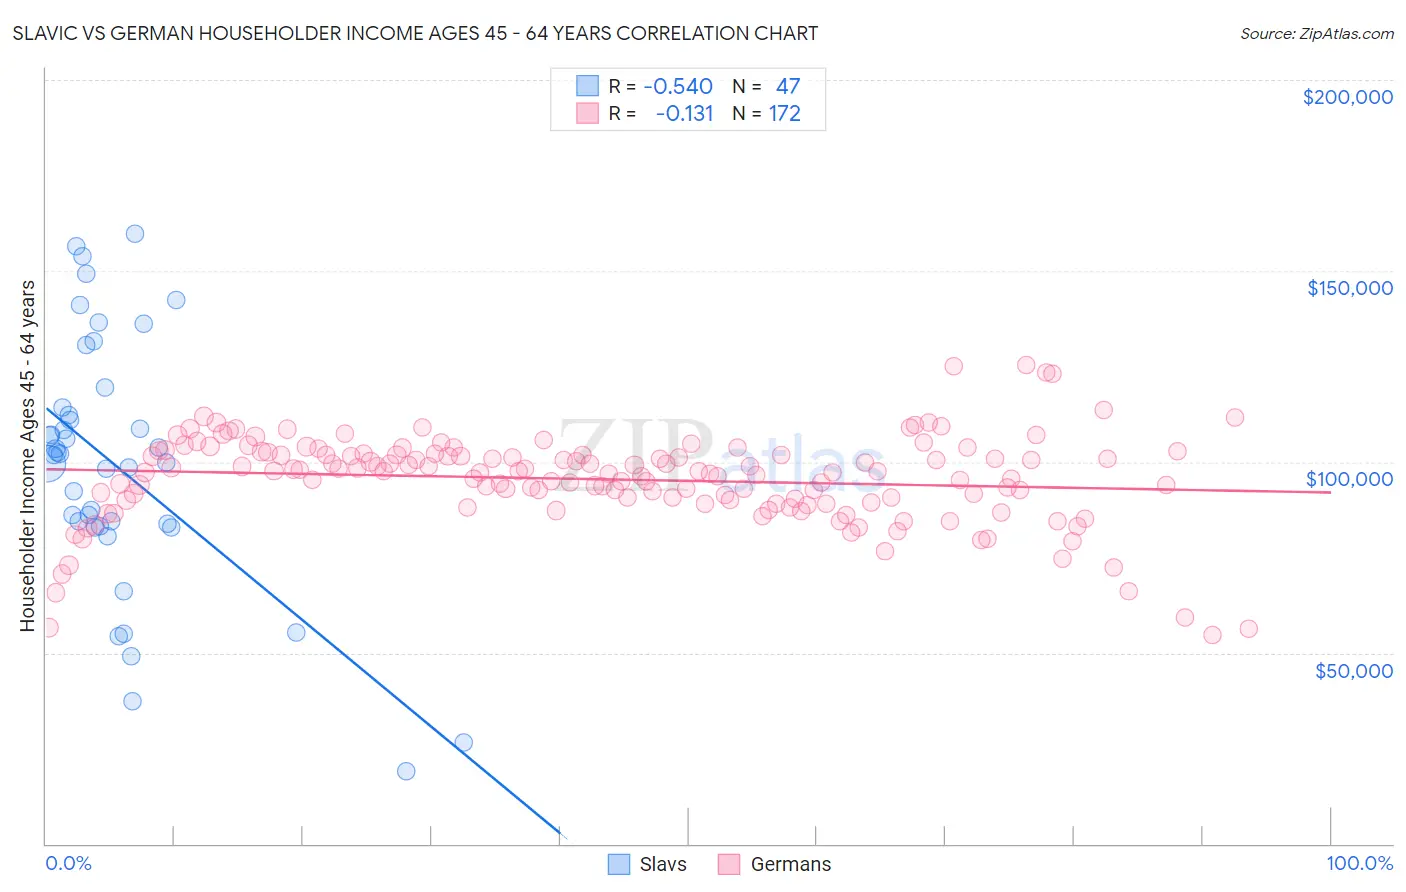
Slavic vs German Householder Income Ages 45 - 64 years Correlation Chart
The statistical analysis conducted on geographies consisting of 270,616,686 people shows a substantial negative correlation between the proportion of Slavs and household income with householder between the ages 45 and 64 in the United States with a correlation coefficient (R) of -0.540 and weighted average of $102,629. Similarly, the statistical analysis conducted on geographies consisting of 575,941,982 people shows a poor negative correlation between the proportion of Germans and household income with householder between the ages 45 and 64 in the United States with a correlation coefficient (R) of -0.131 and weighted average of $100,224, a difference of 2.4%.
Householder Income Ages 45 - 64 years Correlation Summary
| Measurement | Slavic | German |
| Minimum | $18,979 | $54,688 |
| Maximum | $159,583 | $125,293 |
| Range | $140,604 | $70,605 |
| Mean | $98,663 | $95,438 |
| Median | $101,881 | $97,438 |
| Interquartile 25% (IQ1) | $83,250 | $90,029 |
| Interquartile 75% (IQ3) | $114,292 | $102,031 |
| Interquartile Range (IQR) | $31,042 | $12,003 |
| Standard Deviation (Sample) | $32,811 | $11,697 |
| Standard Deviation (Population) | $32,460 | $11,663 |
Demographics Similar to Slavs and Germans by Householder Income Ages 45 - 64 years
In terms of householder income ages 45 - 64 years, the demographic groups most similar to Slavs are Immigrants from Ethiopia ($102,763, a difference of 0.13%), Carpatho Rusyn ($102,777, a difference of 0.14%), Sierra Leonean ($102,427, a difference of 0.20%), Icelander ($102,261, a difference of 0.36%), and Immigrants from Nepal ($102,190, a difference of 0.43%). Similarly, the demographic groups most similar to Germans are Immigrants from Costa Rica ($100,141, a difference of 0.080%), Welsh ($100,322, a difference of 0.10%), Alsatian ($100,435, a difference of 0.21%), Immigrants from Uzbekistan ($100,523, a difference of 0.30%), and South American ($100,837, a difference of 0.61%).
| Demographics | Rating | Rank | Householder Income Ages 45 - 64 years |
| Carpatho Rusyns | 77.4 /100 | #156 | Good $102,777 |
| Immigrants | Ethiopia | 77.3 /100 | #157 | Good $102,763 |
| Slavs | 76.1 /100 | #158 | Good $102,629 |
| Sierra Leoneans | 74.2 /100 | #159 | Good $102,427 |
| Icelanders | 72.5 /100 | #160 | Good $102,261 |
| Immigrants | Nepal | 71.8 /100 | #161 | Good $102,190 |
| Scottish | 71.1 /100 | #162 | Good $102,123 |
| English | 70.1 /100 | #163 | Good $102,021 |
| Immigrants | Morocco | 70.0 /100 | #164 | Good $102,015 |
| Immigrants | Albania | 69.4 /100 | #165 | Good $101,957 |
| Samoans | 65.3 /100 | #166 | Good $101,580 |
| Czechoslovakians | 63.0 /100 | #167 | Good $101,387 |
| South American Indians | 60.5 /100 | #168 | Good $101,171 |
| Guamanians/Chamorros | 60.5 /100 | #169 | Good $101,170 |
| Slovaks | 58.8 /100 | #170 | Average $101,029 |
| South Americans | 56.4 /100 | #171 | Average $100,837 |
| Immigrants | Uzbekistan | 52.5 /100 | #172 | Average $100,523 |
| Alsatians | 51.4 /100 | #173 | Average $100,435 |
| Welsh | 50.0 /100 | #174 | Average $100,322 |
| Germans | 48.8 /100 | #175 | Average $100,224 |
| Immigrants | Costa Rica | 47.7 /100 | #176 | Average $100,141 |