Sioux vs Immigrants from Afghanistan Ambulatory Disability
COMPARE
Sioux
Immigrants from Afghanistan
Ambulatory Disability
Ambulatory Disability Comparison
Sioux
Immigrants from Afghanistan
6.7%
AMBULATORY DISABILITY
0.1/ 100
METRIC RATING
274th/ 347
METRIC RANK
5.6%
AMBULATORY DISABILITY
99.8/ 100
METRIC RATING
59th/ 347
METRIC RANK
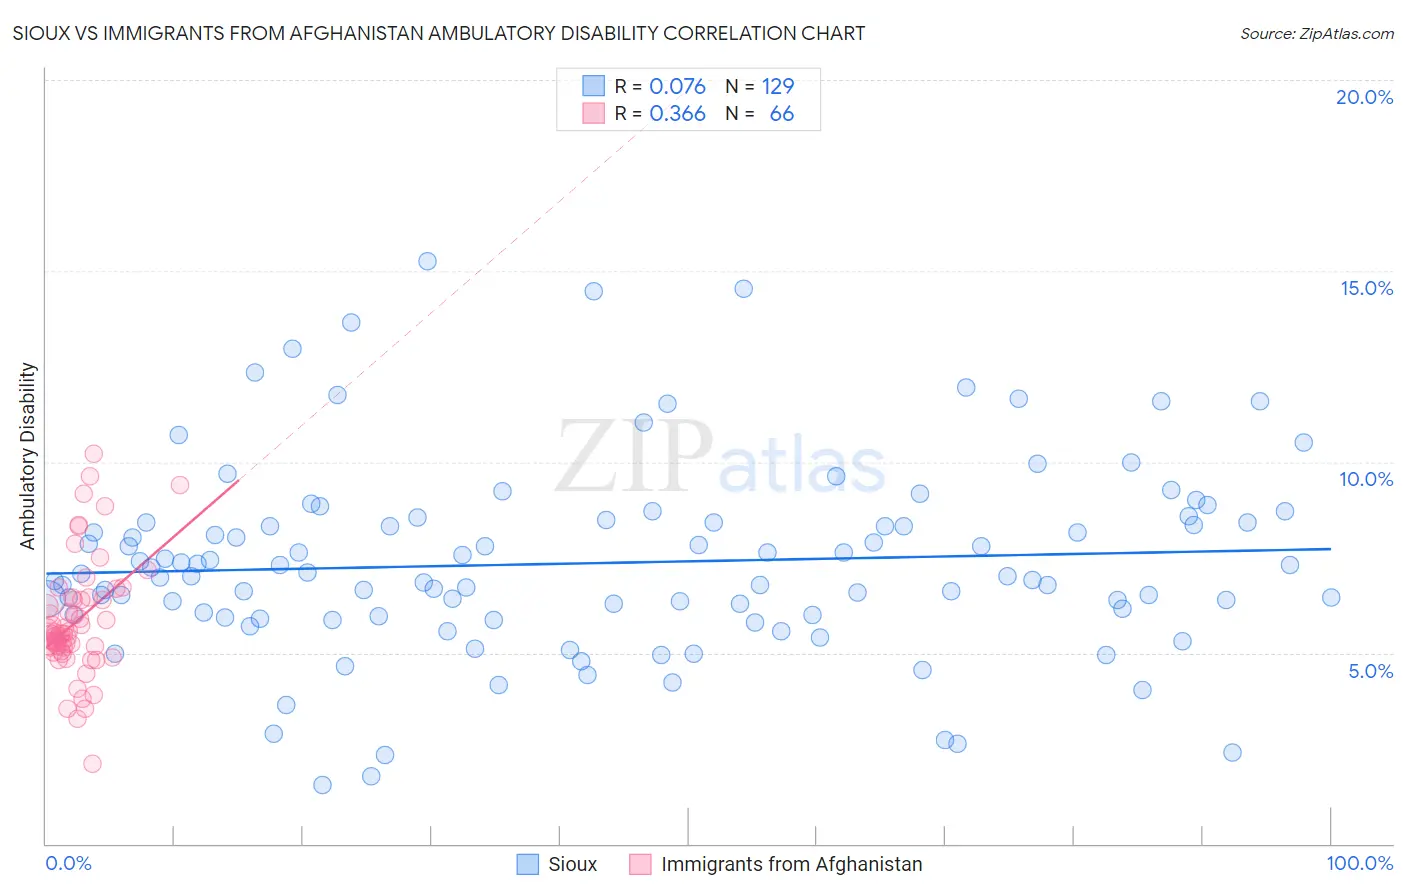
Sioux vs Immigrants from Afghanistan Ambulatory Disability Correlation Chart
The statistical analysis conducted on geographies consisting of 234,119,186 people shows a slight positive correlation between the proportion of Sioux and percentage of population with ambulatory disability in the United States with a correlation coefficient (R) of 0.076 and weighted average of 6.7%. Similarly, the statistical analysis conducted on geographies consisting of 147,636,321 people shows a mild positive correlation between the proportion of Immigrants from Afghanistan and percentage of population with ambulatory disability in the United States with a correlation coefficient (R) of 0.366 and weighted average of 5.6%, a difference of 19.2%.
Ambulatory Disability Correlation Summary
| Measurement | Sioux | Immigrants from Afghanistan |
| Minimum | 1.5% | 2.1% |
| Maximum | 15.2% | 10.2% |
| Range | 13.7% | 8.1% |
| Mean | 7.3% | 5.8% |
| Median | 7.0% | 5.5% |
| Interquartile 25% (IQ1) | 6.0% | 5.1% |
| Interquartile 75% (IQ3) | 8.4% | 6.4% |
| Interquartile Range (IQR) | 2.4% | 1.3% |
| Standard Deviation (Sample) | 2.5% | 1.5% |
| Standard Deviation (Population) | 2.5% | 1.5% |
Similar Demographics by Ambulatory Disability
Demographics Similar to Sioux by Ambulatory Disability
In terms of ambulatory disability, the demographic groups most similar to Sioux are Immigrants from Guyana (6.7%, a difference of 0.060%), Celtic (6.7%, a difference of 0.090%), Jamaican (6.7%, a difference of 0.17%), White/Caucasian (6.7%, a difference of 0.24%), and Immigrants from West Indies (6.7%, a difference of 0.25%).
| Demographics | Rating | Rank | Ambulatory Disability |
| Trinidadians and Tobagonians | 0.2 /100 | #267 | Tragic 6.6% |
| Spanish | 0.2 /100 | #268 | Tragic 6.6% |
| French | 0.1 /100 | #269 | Tragic 6.6% |
| Slovaks | 0.1 /100 | #270 | Tragic 6.7% |
| Immigrants | Trinidad and Tobago | 0.1 /100 | #271 | Tragic 6.7% |
| French Canadians | 0.1 /100 | #272 | Tragic 6.7% |
| Whites/Caucasians | 0.1 /100 | #273 | Tragic 6.7% |
| Sioux | 0.1 /100 | #274 | Tragic 6.7% |
| Immigrants | Guyana | 0.1 /100 | #275 | Tragic 6.7% |
| Celtics | 0.1 /100 | #276 | Tragic 6.7% |
| Jamaicans | 0.1 /100 | #277 | Tragic 6.7% |
| Immigrants | West Indies | 0.1 /100 | #278 | Tragic 6.7% |
| Immigrants | Caribbean | 0.0 /100 | #279 | Tragic 6.7% |
| Pennsylvania Germans | 0.0 /100 | #280 | Tragic 6.8% |
| Yaqui | 0.0 /100 | #281 | Tragic 6.8% |
Demographics Similar to Immigrants from Afghanistan by Ambulatory Disability
In terms of ambulatory disability, the demographic groups most similar to Immigrants from Afghanistan are Immigrants from Zimbabwe (5.6%, a difference of 0.040%), Immigrants from Lithuania (5.6%, a difference of 0.040%), Immigrants from Brazil (5.6%, a difference of 0.10%), Immigrants from Belgium (5.6%, a difference of 0.16%), and Immigrants from Spain (5.6%, a difference of 0.17%).
| Demographics | Rating | Rank | Ambulatory Disability |
| Jordanians | 99.8 /100 | #52 | Exceptional 5.6% |
| Immigrants | Egypt | 99.8 /100 | #53 | Exceptional 5.6% |
| Immigrants | Eastern Africa | 99.8 /100 | #54 | Exceptional 5.6% |
| Immigrants | Bulgaria | 99.8 /100 | #55 | Exceptional 5.6% |
| Inupiat | 99.8 /100 | #56 | Exceptional 5.6% |
| Immigrants | Brazil | 99.8 /100 | #57 | Exceptional 5.6% |
| Immigrants | Zimbabwe | 99.8 /100 | #58 | Exceptional 5.6% |
| Immigrants | Afghanistan | 99.8 /100 | #59 | Exceptional 5.6% |
| Immigrants | Lithuania | 99.8 /100 | #60 | Exceptional 5.6% |
| Immigrants | Belgium | 99.7 /100 | #61 | Exceptional 5.6% |
| Immigrants | Spain | 99.7 /100 | #62 | Exceptional 5.6% |
| Immigrants | France | 99.7 /100 | #63 | Exceptional 5.6% |
| Laotians | 99.7 /100 | #64 | Exceptional 5.7% |
| Immigrants | Switzerland | 99.7 /100 | #65 | Exceptional 5.7% |
| Israelis | 99.6 /100 | #66 | Exceptional 5.7% |