Thai vs Immigrants from Afghanistan Disability Age 5 to 17
COMPARE
Thai
Immigrants from Afghanistan
Disability Age 5 to 17
Disability Age 5 to 17 Comparison
Thais
Immigrants from Afghanistan
4.7%
DISABILITY AGE 5 TO 17
100.0/ 100
METRIC RATING
13th/ 347
METRIC RANK
5.3%
DISABILITY AGE 5 TO 17
97.4/ 100
METRIC RATING
117th/ 347
METRIC RANK
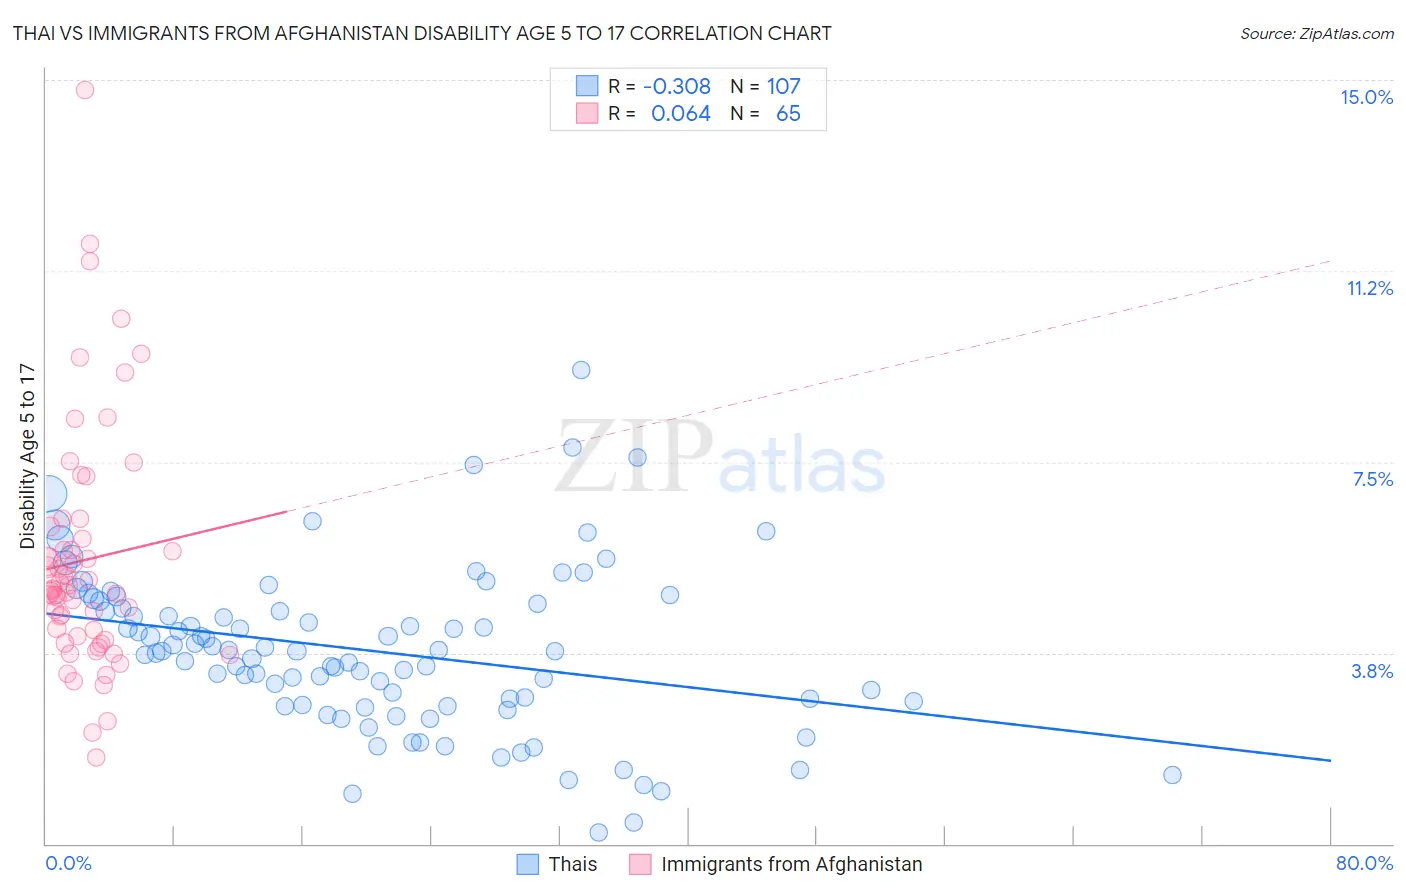
Thai vs Immigrants from Afghanistan Disability Age 5 to 17 Correlation Chart
The statistical analysis conducted on geographies consisting of 470,579,887 people shows a mild negative correlation between the proportion of Thais and percentage of population with a disability between the ages 5 and 17 in the United States with a correlation coefficient (R) of -0.308 and weighted average of 4.7%. Similarly, the statistical analysis conducted on geographies consisting of 147,197,309 people shows a slight positive correlation between the proportion of Immigrants from Afghanistan and percentage of population with a disability between the ages 5 and 17 in the United States with a correlation coefficient (R) of 0.064 and weighted average of 5.3%, a difference of 15.0%.
Disability Age 5 to 17 Correlation Summary
| Measurement | Thai | Immigrants from Afghanistan |
| Minimum | 0.21% | 1.7% |
| Maximum | 9.3% | 14.8% |
| Range | 9.1% | 13.1% |
| Mean | 3.8% | 5.6% |
| Median | 3.8% | 5.0% |
| Interquartile 25% (IQ1) | 2.7% | 4.0% |
| Interquartile 75% (IQ3) | 4.7% | 6.1% |
| Interquartile Range (IQR) | 2.0% | 2.1% |
| Standard Deviation (Sample) | 1.6% | 2.4% |
| Standard Deviation (Population) | 1.6% | 2.4% |
Similar Demographics by Disability Age 5 to 17
Demographics Similar to Thais by Disability Age 5 to 17
In terms of disability age 5 to 17, the demographic groups most similar to Thais are Immigrants from Korea (4.7%, a difference of 0.70%), Chinese (4.7%, a difference of 0.91%), Iranian (4.6%, a difference of 1.1%), Armenian (4.6%, a difference of 1.3%), and Immigrants from Singapore (4.7%, a difference of 1.3%).
| Demographics | Rating | Rank | Disability Age 5 to 17 |
| Immigrants | Israel | 100.0 /100 | #6 | Exceptional 4.5% |
| Immigrants | China | 100.0 /100 | #7 | Exceptional 4.5% |
| Indians (Asian) | 100.0 /100 | #8 | Exceptional 4.6% |
| Immigrants | Eastern Asia | 100.0 /100 | #9 | Exceptional 4.6% |
| Immigrants | India | 100.0 /100 | #10 | Exceptional 4.6% |
| Armenians | 100.0 /100 | #11 | Exceptional 4.6% |
| Iranians | 100.0 /100 | #12 | Exceptional 4.6% |
| Thais | 100.0 /100 | #13 | Exceptional 4.7% |
| Immigrants | Korea | 100.0 /100 | #14 | Exceptional 4.7% |
| Chinese | 100.0 /100 | #15 | Exceptional 4.7% |
| Immigrants | Singapore | 100.0 /100 | #16 | Exceptional 4.7% |
| Arapaho | 100.0 /100 | #17 | Exceptional 4.7% |
| Immigrants | South Central Asia | 100.0 /100 | #18 | Exceptional 4.7% |
| Immigrants | Uzbekistan | 100.0 /100 | #19 | Exceptional 4.8% |
| Burmese | 100.0 /100 | #20 | Exceptional 4.8% |
Demographics Similar to Immigrants from Afghanistan by Disability Age 5 to 17
In terms of disability age 5 to 17, the demographic groups most similar to Immigrants from Afghanistan are South American (5.4%, a difference of 0.11%), Immigrants from South America (5.4%, a difference of 0.11%), Cypriot (5.3%, a difference of 0.16%), Immigrants (5.4%, a difference of 0.17%), and Cuban (5.3%, a difference of 0.23%).
| Demographics | Rating | Rank | Disability Age 5 to 17 |
| Immigrants | Eritrea | 98.0 /100 | #110 | Exceptional 5.3% |
| Ethiopians | 97.9 /100 | #111 | Exceptional 5.3% |
| Immigrants | Latvia | 97.9 /100 | #112 | Exceptional 5.3% |
| Aleuts | 97.8 /100 | #113 | Exceptional 5.3% |
| Immigrants | Northern Europe | 97.8 /100 | #114 | Exceptional 5.3% |
| Cubans | 97.8 /100 | #115 | Exceptional 5.3% |
| Cypriots | 97.7 /100 | #116 | Exceptional 5.3% |
| Immigrants | Afghanistan | 97.4 /100 | #117 | Exceptional 5.3% |
| South Americans | 97.1 /100 | #118 | Exceptional 5.4% |
| Immigrants | South America | 97.1 /100 | #119 | Exceptional 5.4% |
| Immigrants | Immigrants | 97.0 /100 | #120 | Exceptional 5.4% |
| Maltese | 96.0 /100 | #121 | Exceptional 5.4% |
| Chileans | 95.8 /100 | #122 | Exceptional 5.4% |
| Immigrants | Ethiopia | 95.5 /100 | #123 | Exceptional 5.4% |
| Crow | 95.0 /100 | #124 | Exceptional 5.4% |