Sioux vs Hispanic or Latino Male Disability
COMPARE
Sioux
Hispanic or Latino
Male Disability
Male Disability Comparison
Sioux
Hispanics or Latinos
12.7%
MALE DISABILITY
0.0/ 100
METRIC RATING
281st/ 347
METRIC RANK
11.8%
MALE DISABILITY
2.3/ 100
METRIC RATING
228th/ 347
METRIC RANK
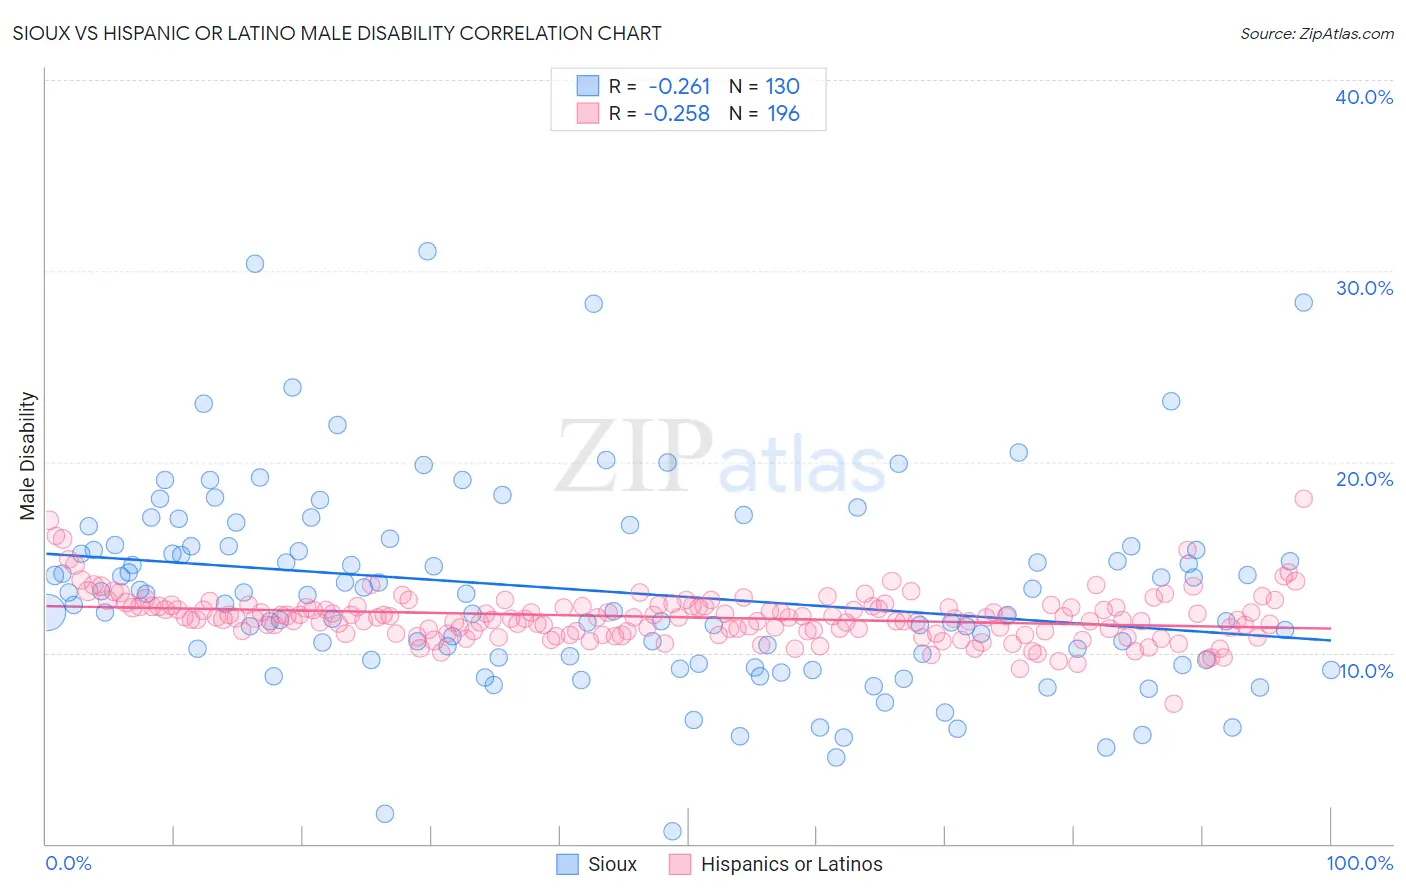
Sioux vs Hispanic or Latino Male Disability Correlation Chart
The statistical analysis conducted on geographies consisting of 234,137,085 people shows a weak negative correlation between the proportion of Sioux and percentage of males with a disability in the United States with a correlation coefficient (R) of -0.261 and weighted average of 12.7%. Similarly, the statistical analysis conducted on geographies consisting of 573,649,400 people shows a weak negative correlation between the proportion of Hispanics or Latinos and percentage of males with a disability in the United States with a correlation coefficient (R) of -0.258 and weighted average of 11.8%, a difference of 7.7%.
Male Disability Correlation Summary
| Measurement | Sioux | Hispanic or Latino |
| Minimum | 0.66% | 7.3% |
| Maximum | 31.1% | 18.1% |
| Range | 30.4% | 10.7% |
| Mean | 13.2% | 11.9% |
| Median | 13.1% | 11.8% |
| Interquartile 25% (IQ1) | 9.8% | 11.1% |
| Interquartile 75% (IQ3) | 15.6% | 12.4% |
| Interquartile Range (IQR) | 5.8% | 1.3% |
| Standard Deviation (Sample) | 5.2% | 1.3% |
| Standard Deviation (Population) | 5.2% | 1.3% |
Similar Demographics by Male Disability
Demographics Similar to Sioux by Male Disability
In terms of male disability, the demographic groups most similar to Sioux are Dutch (12.7%, a difference of 0.060%), Irish (12.7%, a difference of 0.060%), German (12.7%, a difference of 0.070%), Slovak (12.7%, a difference of 0.11%), and Central American Indian (12.7%, a difference of 0.26%).
| Demographics | Rating | Rank | Male Disability |
| Hopi | 0.0 /100 | #274 | Tragic 12.5% |
| Fijians | 0.0 /100 | #275 | Tragic 12.6% |
| Africans | 0.0 /100 | #276 | Tragic 12.6% |
| Finns | 0.0 /100 | #277 | Tragic 12.6% |
| Central American Indians | 0.0 /100 | #278 | Tragic 12.7% |
| Slovaks | 0.0 /100 | #279 | Tragic 12.7% |
| Dutch | 0.0 /100 | #280 | Tragic 12.7% |
| Sioux | 0.0 /100 | #281 | Tragic 12.7% |
| Irish | 0.0 /100 | #282 | Tragic 12.7% |
| Germans | 0.0 /100 | #283 | Tragic 12.7% |
| Spanish | 0.0 /100 | #284 | Tragic 12.7% |
| Welsh | 0.0 /100 | #285 | Tragic 12.7% |
| Scottish | 0.0 /100 | #286 | Tragic 12.8% |
| Cape Verdeans | 0.0 /100 | #287 | Tragic 12.8% |
| Yup'ik | 0.0 /100 | #288 | Tragic 12.8% |
Demographics Similar to Hispanics or Latinos by Male Disability
In terms of male disability, the demographic groups most similar to Hispanics or Latinos are Bermudan (11.8%, a difference of 0.030%), Austrian (11.8%, a difference of 0.080%), Croatian (11.8%, a difference of 0.12%), Subsaharan African (11.8%, a difference of 0.26%), and Dominican (11.8%, a difference of 0.32%).
| Demographics | Rating | Rank | Male Disability |
| Immigrants | Congo | 3.7 /100 | #221 | Tragic 11.7% |
| Alsatians | 3.3 /100 | #222 | Tragic 11.7% |
| Immigrants | Bahamas | 3.2 /100 | #223 | Tragic 11.7% |
| Japanese | 3.1 /100 | #224 | Tragic 11.7% |
| Liberians | 3.1 /100 | #225 | Tragic 11.8% |
| Sub-Saharan Africans | 2.8 /100 | #226 | Tragic 11.8% |
| Austrians | 2.5 /100 | #227 | Tragic 11.8% |
| Hispanics or Latinos | 2.3 /100 | #228 | Tragic 11.8% |
| Bermudans | 2.3 /100 | #229 | Tragic 11.8% |
| Croatians | 2.1 /100 | #230 | Tragic 11.8% |
| Dominicans | 1.8 /100 | #231 | Tragic 11.8% |
| Malaysians | 1.8 /100 | #232 | Tragic 11.8% |
| Mexicans | 1.7 /100 | #233 | Tragic 11.8% |
| Immigrants | Canada | 1.6 /100 | #234 | Tragic 11.9% |
| Immigrants | North America | 1.5 /100 | #235 | Tragic 11.9% |