Sioux vs Hispanic or Latino In Labor Force | Age 45-54
COMPARE
Sioux
Hispanic or Latino
In Labor Force | Age 45-54
In Labor Force | Age 45-54 Comparison
Sioux
Hispanics or Latinos
78.0%
IN LABOR FORCE | AGE 45-54
0.0/ 100
METRIC RATING
328th/ 347
METRIC RANK
80.1%
IN LABOR FORCE | AGE 45-54
0.0/ 100
METRIC RATING
304th/ 347
METRIC RANK
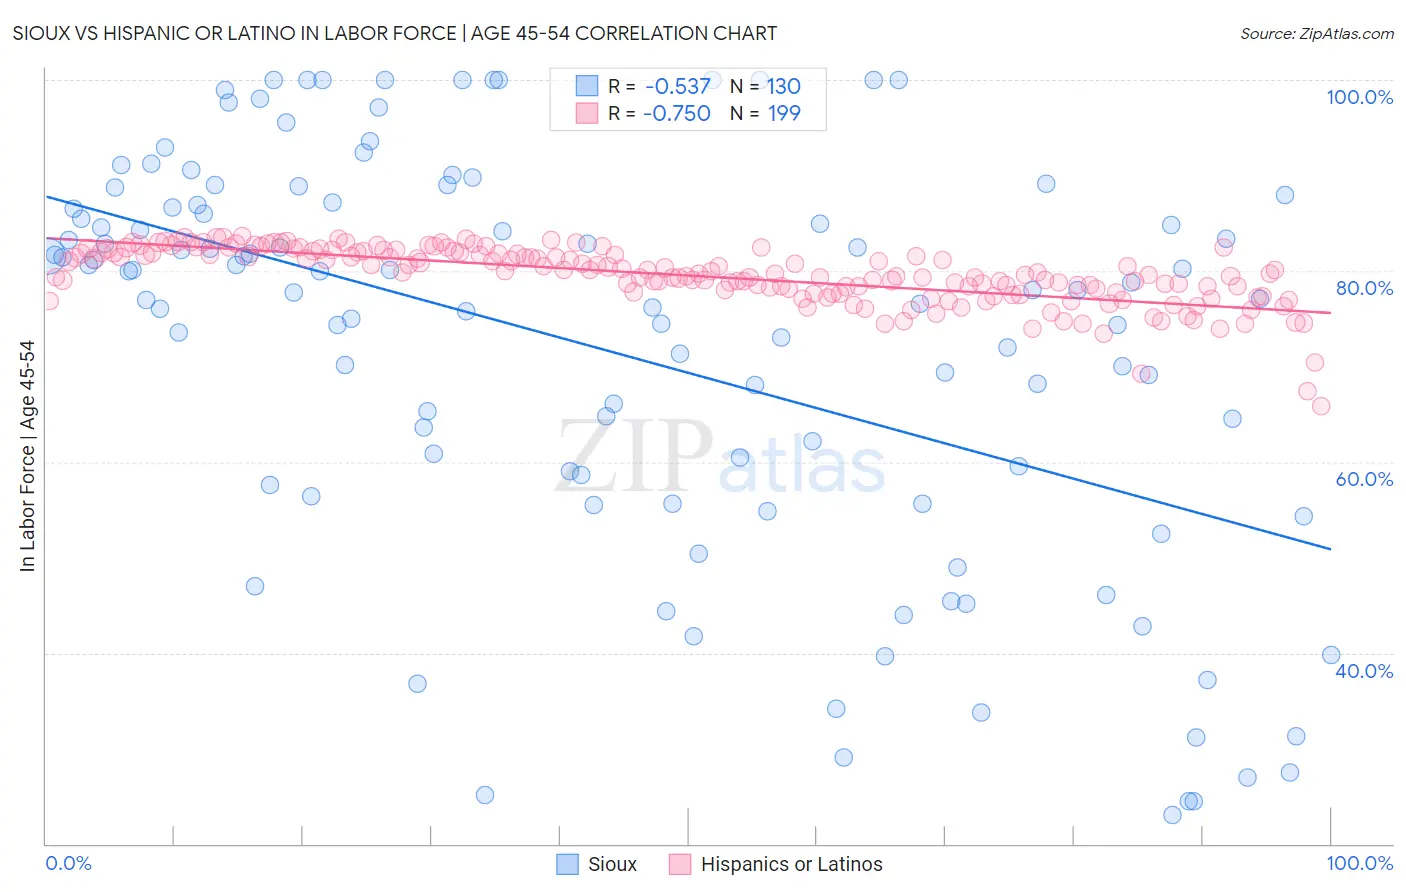
Sioux vs Hispanic or Latino In Labor Force | Age 45-54 Correlation Chart
The statistical analysis conducted on geographies consisting of 234,094,321 people shows a substantial negative correlation between the proportion of Sioux and labor force participation rate among population between the ages 45 and 54 in the United States with a correlation coefficient (R) of -0.537 and weighted average of 78.0%. Similarly, the statistical analysis conducted on geographies consisting of 576,352,392 people shows a strong negative correlation between the proportion of Hispanics or Latinos and labor force participation rate among population between the ages 45 and 54 in the United States with a correlation coefficient (R) of -0.750 and weighted average of 80.1%, a difference of 2.8%.
In Labor Force | Age 45-54 Correlation Summary
| Measurement | Sioux | Hispanic or Latino |
| Minimum | 23.0% | 65.8% |
| Maximum | 100.0% | 83.7% |
| Range | 77.0% | 17.9% |
| Mean | 71.7% | 79.5% |
| Median | 77.9% | 79.8% |
| Interquartile 25% (IQ1) | 57.6% | 77.8% |
| Interquartile 75% (IQ3) | 86.6% | 81.9% |
| Interquartile Range (IQR) | 29.0% | 4.1% |
| Standard Deviation (Sample) | 21.0% | 3.0% |
| Standard Deviation (Population) | 21.0% | 3.0% |
Similar Demographics by In Labor Force | Age 45-54
Demographics Similar to Sioux by In Labor Force | Age 45-54
In terms of in labor force | age 45-54, the demographic groups most similar to Sioux are Cajun (78.1%, a difference of 0.22%), Seminole (78.1%, a difference of 0.23%), Choctaw (78.2%, a difference of 0.28%), Creek (77.7%, a difference of 0.29%), and Dutch West Indian (78.2%, a difference of 0.37%).
| Demographics | Rating | Rank | In Labor Force | Age 45-54 |
| Yup'ik | 0.0 /100 | #321 | Tragic 78.6% |
| Crow | 0.0 /100 | #322 | Tragic 78.3% |
| Kiowa | 0.0 /100 | #323 | Tragic 78.3% |
| Dutch West Indians | 0.0 /100 | #324 | Tragic 78.2% |
| Choctaw | 0.0 /100 | #325 | Tragic 78.2% |
| Seminole | 0.0 /100 | #326 | Tragic 78.1% |
| Cajuns | 0.0 /100 | #327 | Tragic 78.1% |
| Sioux | 0.0 /100 | #328 | Tragic 78.0% |
| Creek | 0.0 /100 | #329 | Tragic 77.7% |
| Cheyenne | 0.0 /100 | #330 | Tragic 77.6% |
| Tsimshian | 0.0 /100 | #331 | Tragic 77.4% |
| Menominee | 0.0 /100 | #332 | Tragic 77.4% |
| Natives/Alaskans | 0.0 /100 | #333 | Tragic 77.1% |
| Apache | 0.0 /100 | #334 | Tragic 77.1% |
| Arapaho | 0.0 /100 | #335 | Tragic 77.1% |
Demographics Similar to Hispanics or Latinos by In Labor Force | Age 45-54
In terms of in labor force | age 45-54, the demographic groups most similar to Hispanics or Latinos are Immigrants from Dominican Republic (80.1%, a difference of 0.010%), Immigrants from the Azores (80.1%, a difference of 0.020%), Spanish American (80.1%, a difference of 0.050%), Immigrants from Central America (80.2%, a difference of 0.090%), and Blackfeet (80.0%, a difference of 0.12%).
| Demographics | Rating | Rank | In Labor Force | Age 45-54 |
| Americans | 0.0 /100 | #297 | Tragic 80.4% |
| Marshallese | 0.0 /100 | #298 | Tragic 80.3% |
| Dominicans | 0.0 /100 | #299 | Tragic 80.3% |
| Fijians | 0.0 /100 | #300 | Tragic 80.2% |
| Spanish American Indians | 0.0 /100 | #301 | Tragic 80.2% |
| Immigrants | Central America | 0.0 /100 | #302 | Tragic 80.2% |
| Immigrants | Azores | 0.0 /100 | #303 | Tragic 80.1% |
| Hispanics or Latinos | 0.0 /100 | #304 | Tragic 80.1% |
| Immigrants | Dominican Republic | 0.0 /100 | #305 | Tragic 80.1% |
| Spanish Americans | 0.0 /100 | #306 | Tragic 80.1% |
| Blackfeet | 0.0 /100 | #307 | Tragic 80.0% |
| Central American Indians | 0.0 /100 | #308 | Tragic 80.0% |
| Potawatomi | 0.0 /100 | #309 | Tragic 80.0% |
| Inupiat | 0.0 /100 | #310 | Tragic 79.9% |
| Mexicans | 0.0 /100 | #311 | Tragic 79.8% |