Sioux vs Immigrants from West Indies Male Disability
COMPARE
Sioux
Immigrants from West Indies
Male Disability
Male Disability Comparison
Sioux
Immigrants from West Indies
12.7%
MALE DISABILITY
0.0/ 100
METRIC RATING
281st/ 347
METRIC RANK
11.1%
MALE DISABILITY
65.7/ 100
METRIC RATING
161st/ 347
METRIC RANK
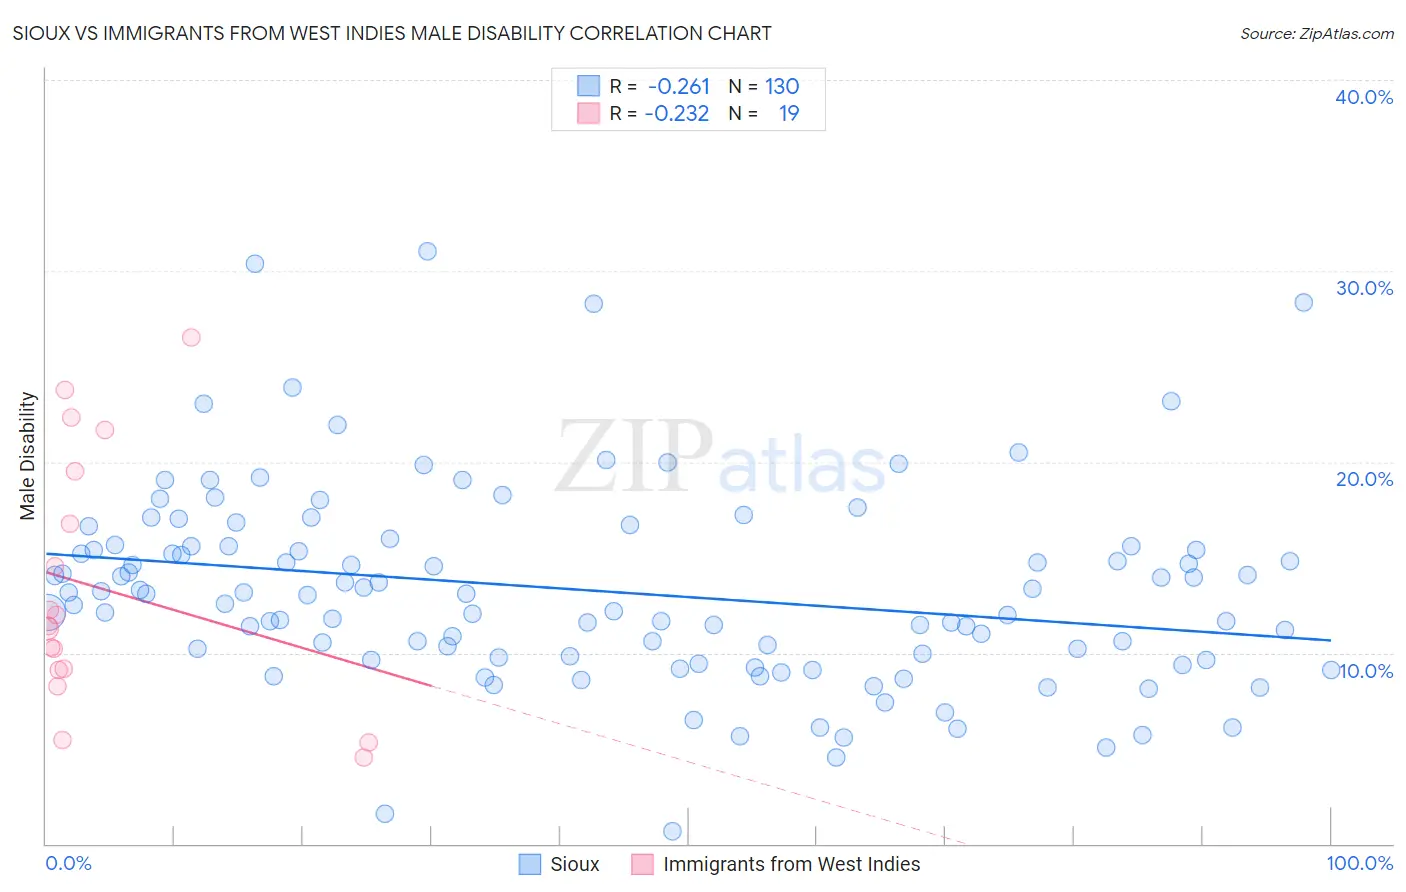
Sioux vs Immigrants from West Indies Male Disability Correlation Chart
The statistical analysis conducted on geographies consisting of 234,137,085 people shows a weak negative correlation between the proportion of Sioux and percentage of males with a disability in the United States with a correlation coefficient (R) of -0.261 and weighted average of 12.7%. Similarly, the statistical analysis conducted on geographies consisting of 72,456,461 people shows a weak negative correlation between the proportion of Immigrants from West Indies and percentage of males with a disability in the United States with a correlation coefficient (R) of -0.232 and weighted average of 11.1%, a difference of 14.3%.
Male Disability Correlation Summary
| Measurement | Sioux | Immigrants from West Indies |
| Minimum | 0.66% | 4.5% |
| Maximum | 31.1% | 26.5% |
| Range | 30.4% | 22.0% |
| Mean | 13.2% | 13.4% |
| Median | 13.1% | 11.4% |
| Interquartile 25% (IQ1) | 9.8% | 9.1% |
| Interquartile 75% (IQ3) | 15.6% | 19.5% |
| Interquartile Range (IQR) | 5.8% | 10.4% |
| Standard Deviation (Sample) | 5.2% | 6.6% |
| Standard Deviation (Population) | 5.2% | 6.4% |
Similar Demographics by Male Disability
Demographics Similar to Sioux by Male Disability
In terms of male disability, the demographic groups most similar to Sioux are Dutch (12.7%, a difference of 0.060%), Irish (12.7%, a difference of 0.060%), German (12.7%, a difference of 0.070%), Slovak (12.7%, a difference of 0.11%), and Central American Indian (12.7%, a difference of 0.26%).
| Demographics | Rating | Rank | Male Disability |
| Hopi | 0.0 /100 | #274 | Tragic 12.5% |
| Fijians | 0.0 /100 | #275 | Tragic 12.6% |
| Africans | 0.0 /100 | #276 | Tragic 12.6% |
| Finns | 0.0 /100 | #277 | Tragic 12.6% |
| Central American Indians | 0.0 /100 | #278 | Tragic 12.7% |
| Slovaks | 0.0 /100 | #279 | Tragic 12.7% |
| Dutch | 0.0 /100 | #280 | Tragic 12.7% |
| Sioux | 0.0 /100 | #281 | Tragic 12.7% |
| Irish | 0.0 /100 | #282 | Tragic 12.7% |
| Germans | 0.0 /100 | #283 | Tragic 12.7% |
| Spanish | 0.0 /100 | #284 | Tragic 12.7% |
| Welsh | 0.0 /100 | #285 | Tragic 12.7% |
| Scottish | 0.0 /100 | #286 | Tragic 12.8% |
| Cape Verdeans | 0.0 /100 | #287 | Tragic 12.8% |
| Yup'ik | 0.0 /100 | #288 | Tragic 12.8% |
Demographics Similar to Immigrants from West Indies by Male Disability
In terms of male disability, the demographic groups most similar to Immigrants from West Indies are Immigrants from Haiti (11.1%, a difference of 0.020%), Albanian (11.1%, a difference of 0.050%), Guatemalan (11.1%, a difference of 0.090%), Immigrants from Kenya (11.1%, a difference of 0.12%), and Latvian (11.1%, a difference of 0.16%).
| Demographics | Rating | Rank | Male Disability |
| Immigrants | Moldova | 72.8 /100 | #154 | Good 11.1% |
| Immigrants | Middle Africa | 70.9 /100 | #155 | Good 11.1% |
| Russians | 69.8 /100 | #156 | Good 11.1% |
| Immigrants | Western Africa | 69.2 /100 | #157 | Good 11.1% |
| Latvians | 68.1 /100 | #158 | Good 11.1% |
| Guatemalans | 67.2 /100 | #159 | Good 11.1% |
| Albanians | 66.5 /100 | #160 | Good 11.1% |
| Immigrants | West Indies | 65.7 /100 | #161 | Good 11.1% |
| Immigrants | Haiti | 65.3 /100 | #162 | Good 11.1% |
| Immigrants | Kenya | 63.8 /100 | #163 | Good 11.1% |
| British West Indians | 62.8 /100 | #164 | Good 11.1% |
| Luxembourgers | 61.9 /100 | #165 | Good 11.1% |
| Immigrants | Hungary | 61.2 /100 | #166 | Good 11.1% |
| Immigrants | Southern Europe | 54.4 /100 | #167 | Average 11.2% |
| Immigrants | Latin America | 54.0 /100 | #168 | Average 11.2% |