Immigrants from Thailand vs Hispanic or Latino Male Disability
COMPARE
Immigrants from Thailand
Hispanic or Latino
Male Disability
Male Disability Comparison
Immigrants from Thailand
Hispanics or Latinos
11.6%
MALE DISABILITY
8.4/ 100
METRIC RATING
211th/ 347
METRIC RANK
11.8%
MALE DISABILITY
2.3/ 100
METRIC RATING
228th/ 347
METRIC RANK
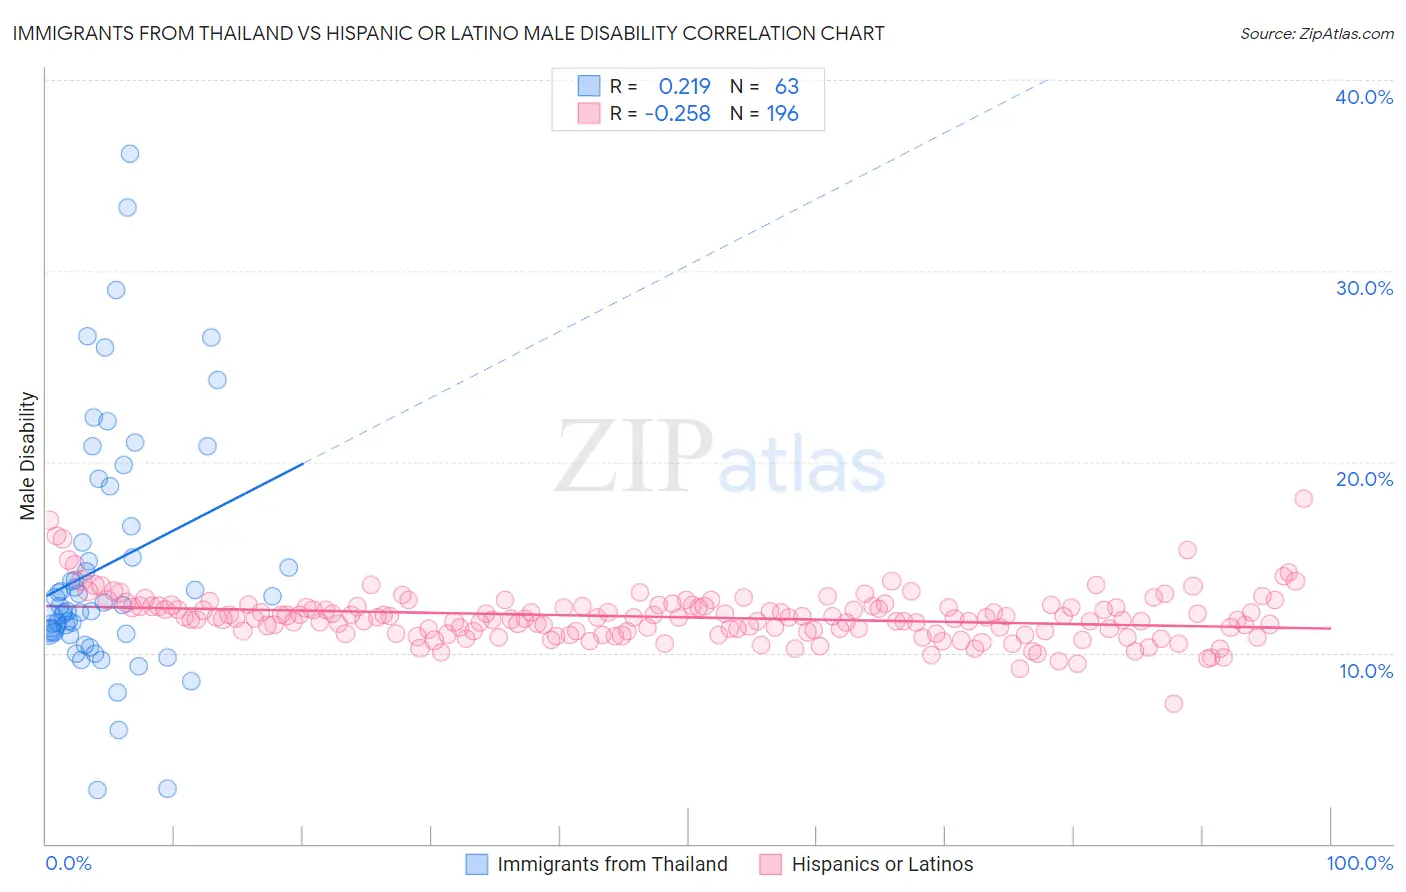
Immigrants from Thailand vs Hispanic or Latino Male Disability Correlation Chart
The statistical analysis conducted on geographies consisting of 316,976,914 people shows a weak positive correlation between the proportion of Immigrants from Thailand and percentage of males with a disability in the United States with a correlation coefficient (R) of 0.219 and weighted average of 11.6%. Similarly, the statistical analysis conducted on geographies consisting of 573,649,400 people shows a weak negative correlation between the proportion of Hispanics or Latinos and percentage of males with a disability in the United States with a correlation coefficient (R) of -0.258 and weighted average of 11.8%, a difference of 1.8%.
Male Disability Correlation Summary
| Measurement | Immigrants from Thailand | Hispanic or Latino |
| Minimum | 2.8% | 7.3% |
| Maximum | 36.2% | 18.1% |
| Range | 33.3% | 10.7% |
| Mean | 14.6% | 11.9% |
| Median | 12.5% | 11.8% |
| Interquartile 25% (IQ1) | 11.1% | 11.1% |
| Interquartile 75% (IQ3) | 16.6% | 12.4% |
| Interquartile Range (IQR) | 5.6% | 1.3% |
| Standard Deviation (Sample) | 6.5% | 1.3% |
| Standard Deviation (Population) | 6.5% | 1.3% |
Demographics Similar to Immigrants from Thailand and Hispanics or Latinos by Male Disability
In terms of male disability, the demographic groups most similar to Immigrants from Thailand are Immigrants from Scotland (11.6%, a difference of 0.030%), Mexican American Indian (11.6%, a difference of 0.10%), Ute (11.6%, a difference of 0.17%), Spanish American Indian (11.6%, a difference of 0.27%), and Lithuanian (11.6%, a difference of 0.35%). Similarly, the demographic groups most similar to Hispanics or Latinos are Bermudan (11.8%, a difference of 0.030%), Austrian (11.8%, a difference of 0.080%), Subsaharan African (11.8%, a difference of 0.26%), Liberian (11.8%, a difference of 0.38%), and Japanese (11.7%, a difference of 0.39%).
| Demographics | Rating | Rank | Male Disability |
| Spanish American Indians | 10.1 /100 | #209 | Poor 11.6% |
| Ute | 9.4 /100 | #210 | Tragic 11.6% |
| Immigrants | Thailand | 8.4 /100 | #211 | Tragic 11.6% |
| Immigrants | Scotland | 8.2 /100 | #212 | Tragic 11.6% |
| Mexican American Indians | 7.8 /100 | #213 | Tragic 11.6% |
| Lithuanians | 6.6 /100 | #214 | Tragic 11.6% |
| Indonesians | 5.9 /100 | #215 | Tragic 11.6% |
| Immigrants | Dominican Republic | 4.9 /100 | #216 | Tragic 11.7% |
| Immigrants | Dominica | 4.6 /100 | #217 | Tragic 11.7% |
| Immigrants | England | 4.0 /100 | #218 | Tragic 11.7% |
| Panamanians | 3.8 /100 | #219 | Tragic 11.7% |
| Immigrants | Western Europe | 3.8 /100 | #220 | Tragic 11.7% |
| Immigrants | Congo | 3.7 /100 | #221 | Tragic 11.7% |
| Alsatians | 3.3 /100 | #222 | Tragic 11.7% |
| Immigrants | Bahamas | 3.2 /100 | #223 | Tragic 11.7% |
| Japanese | 3.1 /100 | #224 | Tragic 11.7% |
| Liberians | 3.1 /100 | #225 | Tragic 11.8% |
| Sub-Saharan Africans | 2.8 /100 | #226 | Tragic 11.8% |
| Austrians | 2.5 /100 | #227 | Tragic 11.8% |
| Hispanics or Latinos | 2.3 /100 | #228 | Tragic 11.8% |
| Bermudans | 2.3 /100 | #229 | Tragic 11.8% |