Sioux vs Immigrants from Nicaragua Male Disability
COMPARE
Sioux
Immigrants from Nicaragua
Male Disability
Male Disability Comparison
Sioux
Immigrants from Nicaragua
12.7%
MALE DISABILITY
0.0/ 100
METRIC RATING
281st/ 347
METRIC RANK
10.6%
MALE DISABILITY
97.8/ 100
METRIC RATING
89th/ 347
METRIC RANK
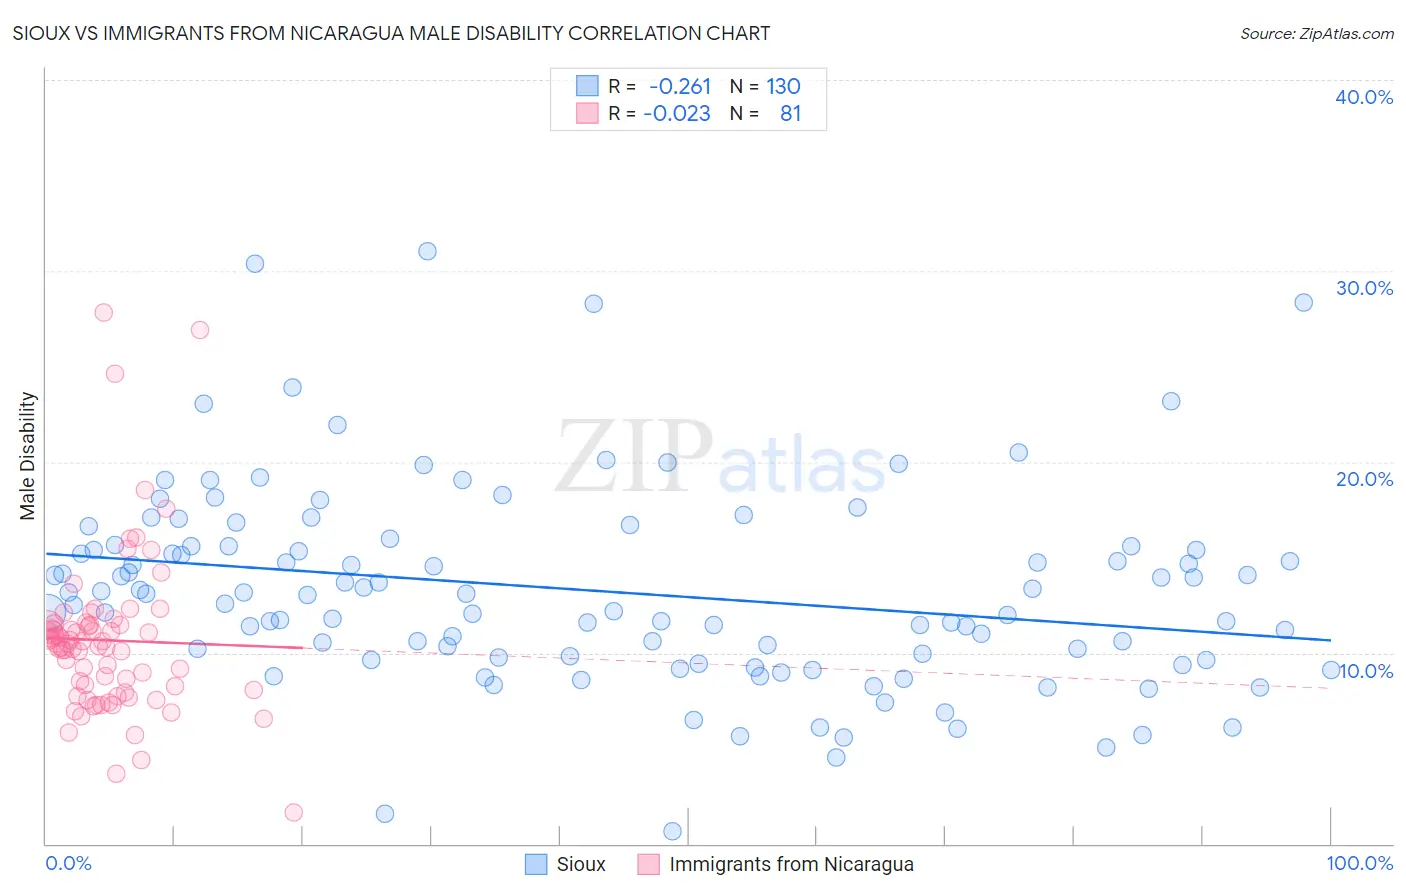
Sioux vs Immigrants from Nicaragua Male Disability Correlation Chart
The statistical analysis conducted on geographies consisting of 234,137,085 people shows a weak negative correlation between the proportion of Sioux and percentage of males with a disability in the United States with a correlation coefficient (R) of -0.261 and weighted average of 12.7%. Similarly, the statistical analysis conducted on geographies consisting of 236,327,634 people shows no correlation between the proportion of Immigrants from Nicaragua and percentage of males with a disability in the United States with a correlation coefficient (R) of -0.023 and weighted average of 10.6%, a difference of 19.5%.
Male Disability Correlation Summary
| Measurement | Sioux | Immigrants from Nicaragua |
| Minimum | 0.66% | 1.6% |
| Maximum | 31.1% | 27.8% |
| Range | 30.4% | 26.2% |
| Mean | 13.2% | 10.7% |
| Median | 13.1% | 10.5% |
| Interquartile 25% (IQ1) | 9.8% | 8.0% |
| Interquartile 75% (IQ3) | 15.6% | 11.4% |
| Interquartile Range (IQR) | 5.8% | 3.5% |
| Standard Deviation (Sample) | 5.2% | 4.2% |
| Standard Deviation (Population) | 5.2% | 4.2% |
Similar Demographics by Male Disability
Demographics Similar to Sioux by Male Disability
In terms of male disability, the demographic groups most similar to Sioux are Dutch (12.7%, a difference of 0.060%), Irish (12.7%, a difference of 0.060%), German (12.7%, a difference of 0.070%), Slovak (12.7%, a difference of 0.11%), and Central American Indian (12.7%, a difference of 0.26%).
| Demographics | Rating | Rank | Male Disability |
| Hopi | 0.0 /100 | #274 | Tragic 12.5% |
| Fijians | 0.0 /100 | #275 | Tragic 12.6% |
| Africans | 0.0 /100 | #276 | Tragic 12.6% |
| Finns | 0.0 /100 | #277 | Tragic 12.6% |
| Central American Indians | 0.0 /100 | #278 | Tragic 12.7% |
| Slovaks | 0.0 /100 | #279 | Tragic 12.7% |
| Dutch | 0.0 /100 | #280 | Tragic 12.7% |
| Sioux | 0.0 /100 | #281 | Tragic 12.7% |
| Irish | 0.0 /100 | #282 | Tragic 12.7% |
| Germans | 0.0 /100 | #283 | Tragic 12.7% |
| Spanish | 0.0 /100 | #284 | Tragic 12.7% |
| Welsh | 0.0 /100 | #285 | Tragic 12.7% |
| Scottish | 0.0 /100 | #286 | Tragic 12.8% |
| Cape Verdeans | 0.0 /100 | #287 | Tragic 12.8% |
| Yup'ik | 0.0 /100 | #288 | Tragic 12.8% |
Demographics Similar to Immigrants from Nicaragua by Male Disability
In terms of male disability, the demographic groups most similar to Immigrants from Nicaragua are Immigrants from Western Asia (10.6%, a difference of 0.0%), Immigrants from Morocco (10.6%, a difference of 0.050%), Immigrants from Vietnam (10.6%, a difference of 0.070%), Immigrants from Ireland (10.6%, a difference of 0.090%), and Immigrants from France (10.6%, a difference of 0.090%).
| Demographics | Rating | Rank | Male Disability |
| Immigrants | Guyana | 98.2 /100 | #82 | Exceptional 10.6% |
| Immigrants | Poland | 98.1 /100 | #83 | Exceptional 10.6% |
| Bulgarians | 98.1 /100 | #84 | Exceptional 10.6% |
| Sri Lankans | 97.9 /100 | #85 | Exceptional 10.6% |
| Immigrants | Ireland | 97.9 /100 | #86 | Exceptional 10.6% |
| Immigrants | Vietnam | 97.9 /100 | #87 | Exceptional 10.6% |
| Immigrants | Western Asia | 97.8 /100 | #88 | Exceptional 10.6% |
| Immigrants | Nicaragua | 97.8 /100 | #89 | Exceptional 10.6% |
| Immigrants | Morocco | 97.7 /100 | #90 | Exceptional 10.6% |
| Immigrants | France | 97.6 /100 | #91 | Exceptional 10.6% |
| Palestinians | 97.4 /100 | #92 | Exceptional 10.7% |
| Immigrants | St. Vincent and the Grenadines | 97.1 /100 | #93 | Exceptional 10.7% |
| Immigrants | Sweden | 96.9 /100 | #94 | Exceptional 10.7% |
| Chileans | 96.9 /100 | #95 | Exceptional 10.7% |
| Nicaraguans | 96.6 /100 | #96 | Exceptional 10.7% |