Sioux vs Immigrants from Netherlands Male Disability
COMPARE
Sioux
Immigrants from Netherlands
Male Disability
Male Disability Comparison
Sioux
Immigrants from Netherlands
12.7%
MALE DISABILITY
0.0/ 100
METRIC RATING
281st/ 347
METRIC RANK
11.4%
MALE DISABILITY
25.9/ 100
METRIC RATING
189th/ 347
METRIC RANK
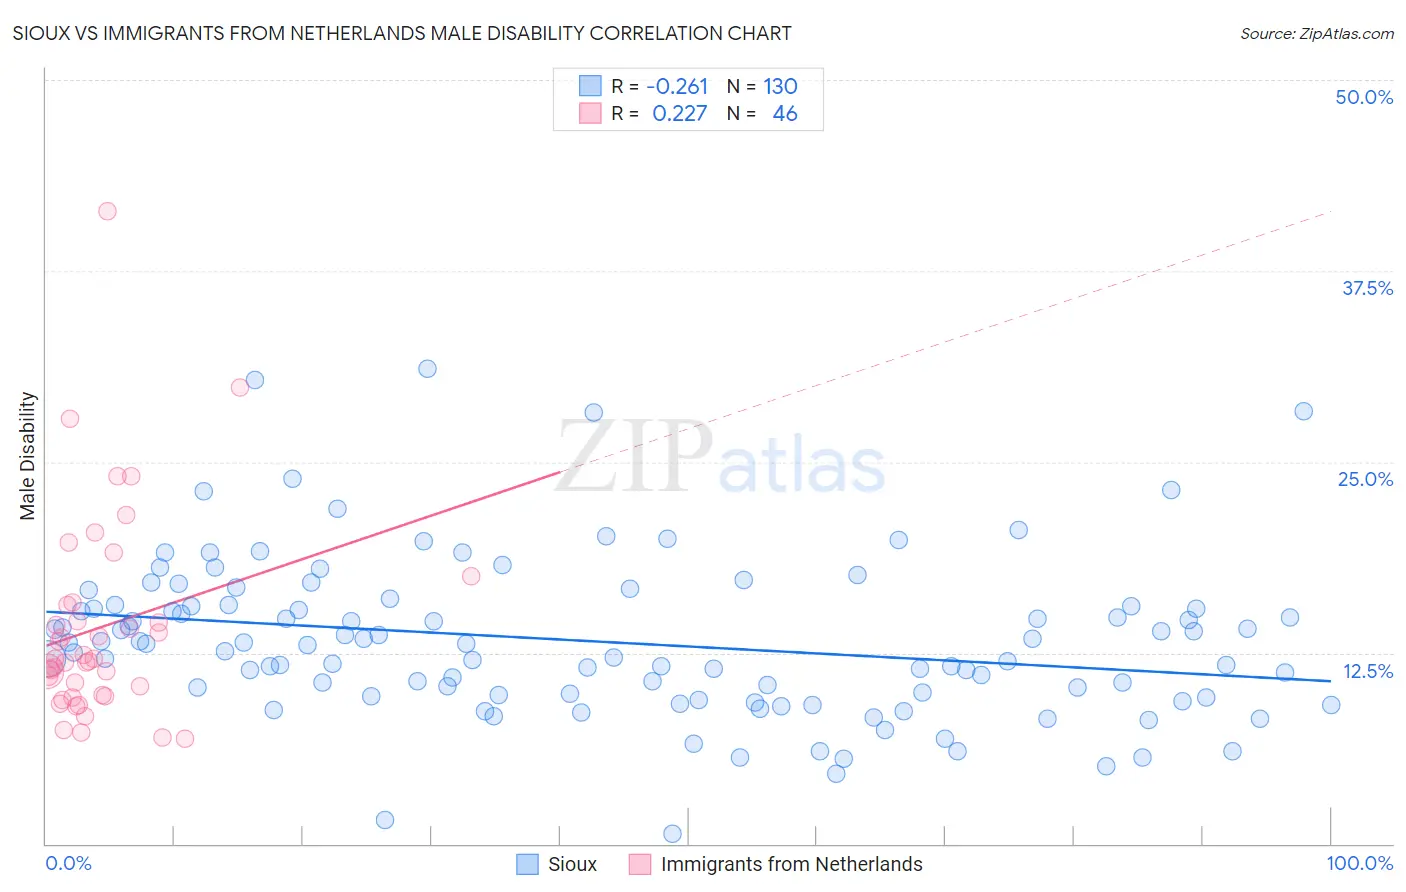
Sioux vs Immigrants from Netherlands Male Disability Correlation Chart
The statistical analysis conducted on geographies consisting of 234,137,085 people shows a weak negative correlation between the proportion of Sioux and percentage of males with a disability in the United States with a correlation coefficient (R) of -0.261 and weighted average of 12.7%. Similarly, the statistical analysis conducted on geographies consisting of 237,879,390 people shows a weak positive correlation between the proportion of Immigrants from Netherlands and percentage of males with a disability in the United States with a correlation coefficient (R) of 0.227 and weighted average of 11.4%, a difference of 11.7%.
Male Disability Correlation Summary
| Measurement | Sioux | Immigrants from Netherlands |
| Minimum | 0.66% | 6.9% |
| Maximum | 31.1% | 41.4% |
| Range | 30.4% | 34.5% |
| Mean | 13.2% | 14.2% |
| Median | 13.1% | 12.0% |
| Interquartile 25% (IQ1) | 9.8% | 9.8% |
| Interquartile 75% (IQ3) | 15.6% | 15.6% |
| Interquartile Range (IQR) | 5.8% | 5.8% |
| Standard Deviation (Sample) | 5.2% | 6.7% |
| Standard Deviation (Population) | 5.2% | 6.6% |
Similar Demographics by Male Disability
Demographics Similar to Sioux by Male Disability
In terms of male disability, the demographic groups most similar to Sioux are Dutch (12.7%, a difference of 0.060%), Irish (12.7%, a difference of 0.060%), German (12.7%, a difference of 0.070%), Slovak (12.7%, a difference of 0.11%), and Central American Indian (12.7%, a difference of 0.26%).
| Demographics | Rating | Rank | Male Disability |
| Hopi | 0.0 /100 | #274 | Tragic 12.5% |
| Fijians | 0.0 /100 | #275 | Tragic 12.6% |
| Africans | 0.0 /100 | #276 | Tragic 12.6% |
| Finns | 0.0 /100 | #277 | Tragic 12.6% |
| Central American Indians | 0.0 /100 | #278 | Tragic 12.7% |
| Slovaks | 0.0 /100 | #279 | Tragic 12.7% |
| Dutch | 0.0 /100 | #280 | Tragic 12.7% |
| Sioux | 0.0 /100 | #281 | Tragic 12.7% |
| Irish | 0.0 /100 | #282 | Tragic 12.7% |
| Germans | 0.0 /100 | #283 | Tragic 12.7% |
| Spanish | 0.0 /100 | #284 | Tragic 12.7% |
| Welsh | 0.0 /100 | #285 | Tragic 12.7% |
| Scottish | 0.0 /100 | #286 | Tragic 12.8% |
| Cape Verdeans | 0.0 /100 | #287 | Tragic 12.8% |
| Yup'ik | 0.0 /100 | #288 | Tragic 12.8% |
Demographics Similar to Immigrants from Netherlands by Male Disability
In terms of male disability, the demographic groups most similar to Immigrants from Netherlands are Immigrants from Bosnia and Herzegovina (11.4%, a difference of 0.040%), Estonian (11.4%, a difference of 0.060%), Immigrants from Austria (11.4%, a difference of 0.10%), Immigrants from Zaire (11.4%, a difference of 0.12%), and Senegalese (11.4%, a difference of 0.20%).
| Demographics | Rating | Rank | Male Disability |
| Immigrants | Belize | 33.7 /100 | #182 | Fair 11.3% |
| Immigrants | Central America | 32.9 /100 | #183 | Fair 11.3% |
| Iraqis | 30.5 /100 | #184 | Fair 11.3% |
| Pakistanis | 30.3 /100 | #185 | Fair 11.3% |
| Immigrants | Zaire | 27.6 /100 | #186 | Fair 11.4% |
| Immigrants | Austria | 27.3 /100 | #187 | Fair 11.4% |
| Estonians | 26.8 /100 | #188 | Fair 11.4% |
| Immigrants | Netherlands | 25.9 /100 | #189 | Fair 11.4% |
| Immigrants | Bosnia and Herzegovina | 25.4 /100 | #190 | Fair 11.4% |
| Senegalese | 23.2 /100 | #191 | Fair 11.4% |
| Assyrians/Chaldeans/Syriacs | 23.2 /100 | #192 | Fair 11.4% |
| Greeks | 22.2 /100 | #193 | Fair 11.4% |
| Belizeans | 21.2 /100 | #194 | Fair 11.4% |
| Immigrants | Oceania | 20.9 /100 | #195 | Fair 11.4% |
| West Indians | 18.4 /100 | #196 | Poor 11.4% |