Sierra Leonean vs Chinese Disability
COMPARE
Sierra Leonean
Chinese
Disability
Disability Comparison
Sierra Leoneans
Chinese
11.0%
DISABILITY
99.3/ 100
METRIC RATING
76th/ 347
METRIC RANK
12.2%
DISABILITY
2.0/ 100
METRIC RATING
236th/ 347
METRIC RANK
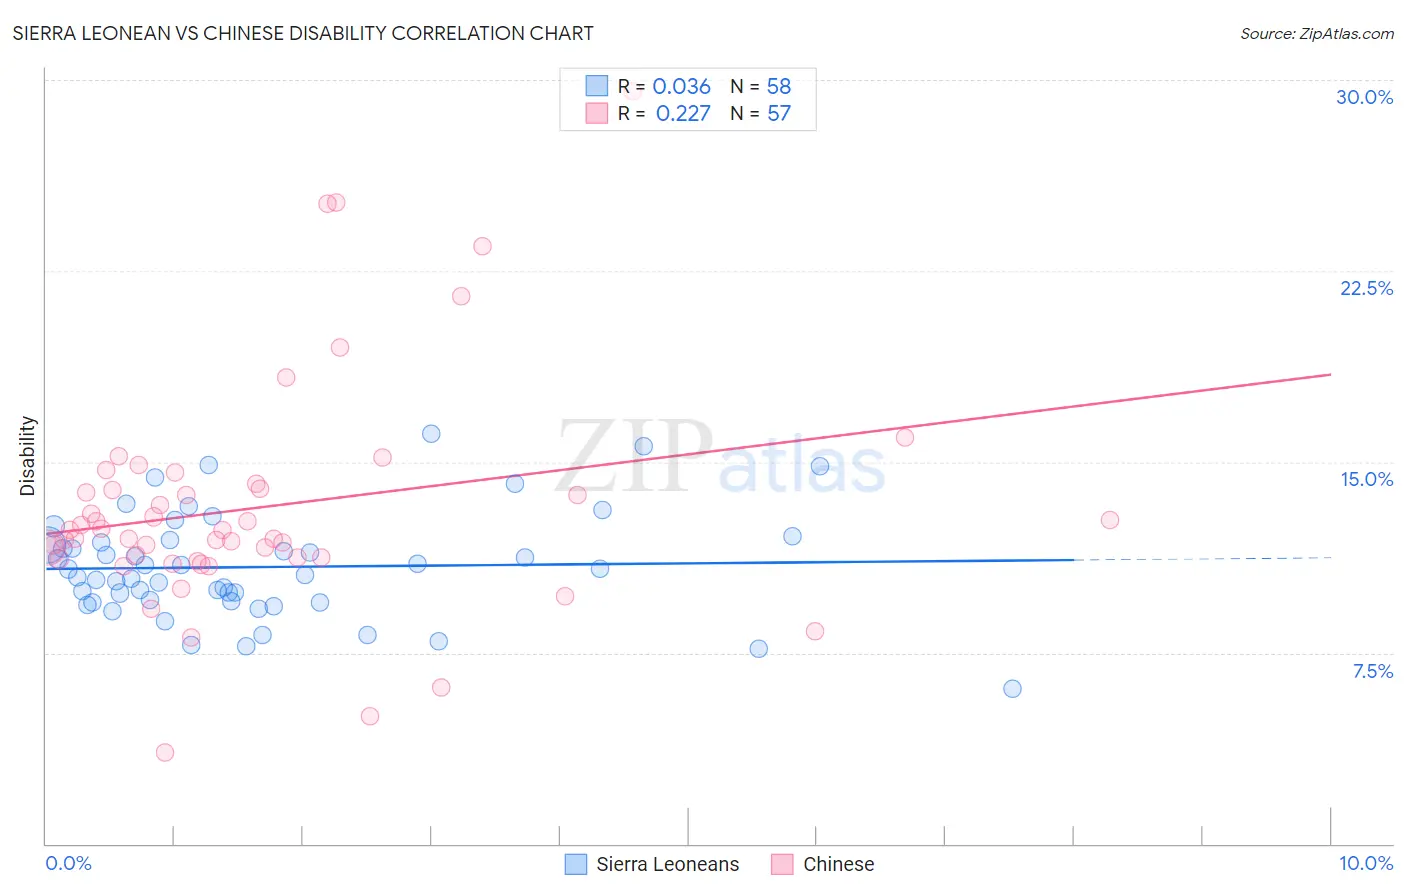
Sierra Leonean vs Chinese Disability Correlation Chart
The statistical analysis conducted on geographies consisting of 83,353,853 people shows no correlation between the proportion of Sierra Leoneans and percentage of population with a disability in the United States with a correlation coefficient (R) of 0.036 and weighted average of 11.0%. Similarly, the statistical analysis conducted on geographies consisting of 64,802,035 people shows a weak positive correlation between the proportion of Chinese and percentage of population with a disability in the United States with a correlation coefficient (R) of 0.227 and weighted average of 12.2%, a difference of 10.4%.
Disability Correlation Summary
| Measurement | Sierra Leonean | Chinese |
| Minimum | 6.1% | 3.6% |
| Maximum | 16.1% | 29.6% |
| Range | 10.0% | 26.0% |
| Mean | 10.9% | 13.2% |
| Median | 10.7% | 12.3% |
| Interquartile 25% (IQ1) | 9.5% | 11.2% |
| Interquartile 75% (IQ3) | 11.8% | 14.0% |
| Interquartile Range (IQR) | 2.3% | 2.8% |
| Standard Deviation (Sample) | 2.1% | 4.6% |
| Standard Deviation (Population) | 2.0% | 4.6% |
Similar Demographics by Disability
Demographics Similar to Sierra Leoneans by Disability
In terms of disability, the demographic groups most similar to Sierra Leoneans are Immigrants from Belgium (11.0%, a difference of 0.0%), Immigrants from Vietnam (11.0%, a difference of 0.030%), Immigrants from Cameroon (11.1%, a difference of 0.040%), Immigrants from Serbia (11.0%, a difference of 0.050%), and Immigrants from Bangladesh (11.0%, a difference of 0.070%).
| Demographics | Rating | Rank | Disability |
| Sri Lankans | 99.5 /100 | #69 | Exceptional 11.0% |
| Immigrants | France | 99.4 /100 | #70 | Exceptional 11.0% |
| Immigrants | Lebanon | 99.4 /100 | #71 | Exceptional 11.0% |
| Immigrants | Chile | 99.4 /100 | #72 | Exceptional 11.0% |
| Immigrants | Bangladesh | 99.4 /100 | #73 | Exceptional 11.0% |
| Immigrants | Serbia | 99.4 /100 | #74 | Exceptional 11.0% |
| Immigrants | Vietnam | 99.4 /100 | #75 | Exceptional 11.0% |
| Sierra Leoneans | 99.3 /100 | #76 | Exceptional 11.0% |
| Immigrants | Belgium | 99.3 /100 | #77 | Exceptional 11.0% |
| Immigrants | Cameroon | 99.3 /100 | #78 | Exceptional 11.1% |
| Immigrants | Jordan | 99.3 /100 | #79 | Exceptional 11.1% |
| Immigrants | Ireland | 99.3 /100 | #80 | Exceptional 11.1% |
| Immigrants | Poland | 99.1 /100 | #81 | Exceptional 11.1% |
| Chileans | 99.1 /100 | #82 | Exceptional 11.1% |
| Immigrants | Switzerland | 99.0 /100 | #83 | Exceptional 11.1% |
Demographics Similar to Chinese by Disability
In terms of disability, the demographic groups most similar to Chinese are Immigrants from Congo (12.2%, a difference of 0.050%), Yup'ik (12.2%, a difference of 0.090%), Norwegian (12.2%, a difference of 0.090%), Japanese (12.2%, a difference of 0.13%), and Swedish (12.2%, a difference of 0.13%).
| Demographics | Rating | Rank | Disability |
| Inupiat | 2.8 /100 | #229 | Tragic 12.2% |
| Samoans | 2.6 /100 | #230 | Tragic 12.2% |
| Malaysians | 2.5 /100 | #231 | Tragic 12.2% |
| Italians | 2.5 /100 | #232 | Tragic 12.2% |
| Bahamians | 2.3 /100 | #233 | Tragic 12.2% |
| Japanese | 2.3 /100 | #234 | Tragic 12.2% |
| Yup'ik | 2.2 /100 | #235 | Tragic 12.2% |
| Chinese | 2.0 /100 | #236 | Tragic 12.2% |
| Immigrants | Congo | 1.9 /100 | #237 | Tragic 12.2% |
| Norwegians | 1.9 /100 | #238 | Tragic 12.2% |
| Swedes | 1.8 /100 | #239 | Tragic 12.2% |
| Hungarians | 1.7 /100 | #240 | Tragic 12.2% |
| Yugoslavians | 1.7 /100 | #241 | Tragic 12.2% |
| Poles | 1.7 /100 | #242 | Tragic 12.2% |
| British | 1.5 /100 | #243 | Tragic 12.2% |