Sierra Leonean vs Immigrants from Laos Disability
COMPARE
Sierra Leonean
Immigrants from Laos
Disability
Disability Comparison
Sierra Leoneans
Immigrants from Laos
11.0%
DISABILITY
99.3/ 100
METRIC RATING
76th/ 347
METRIC RANK
12.4%
DISABILITY
0.5/ 100
METRIC RATING
257th/ 347
METRIC RANK
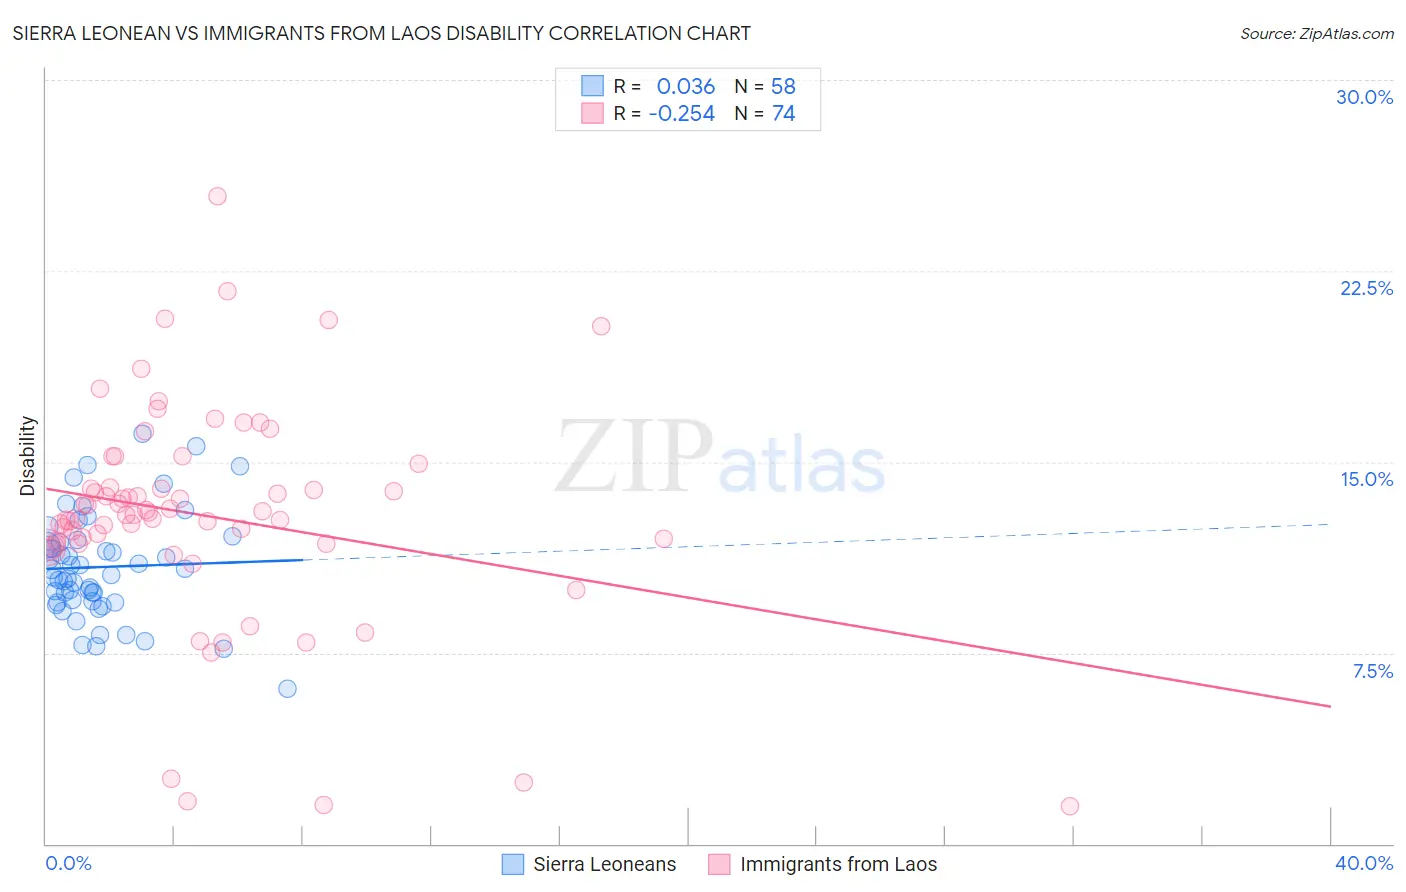
Sierra Leonean vs Immigrants from Laos Disability Correlation Chart
The statistical analysis conducted on geographies consisting of 83,353,853 people shows no correlation between the proportion of Sierra Leoneans and percentage of population with a disability in the United States with a correlation coefficient (R) of 0.036 and weighted average of 11.0%. Similarly, the statistical analysis conducted on geographies consisting of 201,466,628 people shows a weak negative correlation between the proportion of Immigrants from Laos and percentage of population with a disability in the United States with a correlation coefficient (R) of -0.254 and weighted average of 12.4%, a difference of 12.0%.
Disability Correlation Summary
| Measurement | Sierra Leonean | Immigrants from Laos |
| Minimum | 6.1% | 1.4% |
| Maximum | 16.1% | 25.4% |
| Range | 10.0% | 24.0% |
| Mean | 10.9% | 12.9% |
| Median | 10.7% | 13.0% |
| Interquartile 25% (IQ1) | 9.5% | 11.8% |
| Interquartile 75% (IQ3) | 11.8% | 14.0% |
| Interquartile Range (IQR) | 2.3% | 2.2% |
| Standard Deviation (Sample) | 2.1% | 4.3% |
| Standard Deviation (Population) | 2.0% | 4.3% |
Similar Demographics by Disability
Demographics Similar to Sierra Leoneans by Disability
In terms of disability, the demographic groups most similar to Sierra Leoneans are Immigrants from Belgium (11.0%, a difference of 0.0%), Immigrants from Vietnam (11.0%, a difference of 0.030%), Immigrants from Cameroon (11.1%, a difference of 0.040%), Immigrants from Serbia (11.0%, a difference of 0.050%), and Immigrants from Bangladesh (11.0%, a difference of 0.070%).
| Demographics | Rating | Rank | Disability |
| Sri Lankans | 99.5 /100 | #69 | Exceptional 11.0% |
| Immigrants | France | 99.4 /100 | #70 | Exceptional 11.0% |
| Immigrants | Lebanon | 99.4 /100 | #71 | Exceptional 11.0% |
| Immigrants | Chile | 99.4 /100 | #72 | Exceptional 11.0% |
| Immigrants | Bangladesh | 99.4 /100 | #73 | Exceptional 11.0% |
| Immigrants | Serbia | 99.4 /100 | #74 | Exceptional 11.0% |
| Immigrants | Vietnam | 99.4 /100 | #75 | Exceptional 11.0% |
| Sierra Leoneans | 99.3 /100 | #76 | Exceptional 11.0% |
| Immigrants | Belgium | 99.3 /100 | #77 | Exceptional 11.0% |
| Immigrants | Cameroon | 99.3 /100 | #78 | Exceptional 11.1% |
| Immigrants | Jordan | 99.3 /100 | #79 | Exceptional 11.1% |
| Immigrants | Ireland | 99.3 /100 | #80 | Exceptional 11.1% |
| Immigrants | Poland | 99.1 /100 | #81 | Exceptional 11.1% |
| Chileans | 99.1 /100 | #82 | Exceptional 11.1% |
| Immigrants | Switzerland | 99.0 /100 | #83 | Exceptional 11.1% |
Demographics Similar to Immigrants from Laos by Disability
In terms of disability, the demographic groups most similar to Immigrants from Laos are Immigrants from Dominica (12.4%, a difference of 0.090%), Slavic (12.4%, a difference of 0.14%), Slovene (12.4%, a difference of 0.16%), Canadian (12.4%, a difference of 0.20%), and Immigrants from Liberia (12.4%, a difference of 0.23%).
| Demographics | Rating | Rank | Disability |
| Sub-Saharan Africans | 1.4 /100 | #250 | Tragic 12.3% |
| Europeans | 1.4 /100 | #251 | Tragic 12.3% |
| Bermudans | 1.1 /100 | #252 | Tragic 12.3% |
| Belgians | 0.8 /100 | #253 | Tragic 12.3% |
| German Russians | 0.8 /100 | #254 | Tragic 12.3% |
| Slovenes | 0.6 /100 | #255 | Tragic 12.4% |
| Immigrants | Dominica | 0.6 /100 | #256 | Tragic 12.4% |
| Immigrants | Laos | 0.5 /100 | #257 | Tragic 12.4% |
| Slavs | 0.5 /100 | #258 | Tragic 12.4% |
| Canadians | 0.4 /100 | #259 | Tragic 12.4% |
| Immigrants | Liberia | 0.4 /100 | #260 | Tragic 12.4% |
| Scandinavians | 0.4 /100 | #261 | Tragic 12.4% |
| Native Hawaiians | 0.3 /100 | #262 | Tragic 12.5% |
| Hawaiians | 0.2 /100 | #263 | Tragic 12.5% |
| Immigrants | Germany | 0.2 /100 | #264 | Tragic 12.5% |