Sierra Leonean vs Iraqi Cognitive Disability
COMPARE
Sierra Leonean
Iraqi
Cognitive Disability
Cognitive Disability Comparison
Sierra Leoneans
Iraqis
17.9%
COGNITIVE DISABILITY
0.4/ 100
METRIC RATING
262nd/ 347
METRIC RANK
17.8%
COGNITIVE DISABILITY
1.4/ 100
METRIC RATING
240th/ 347
METRIC RANK
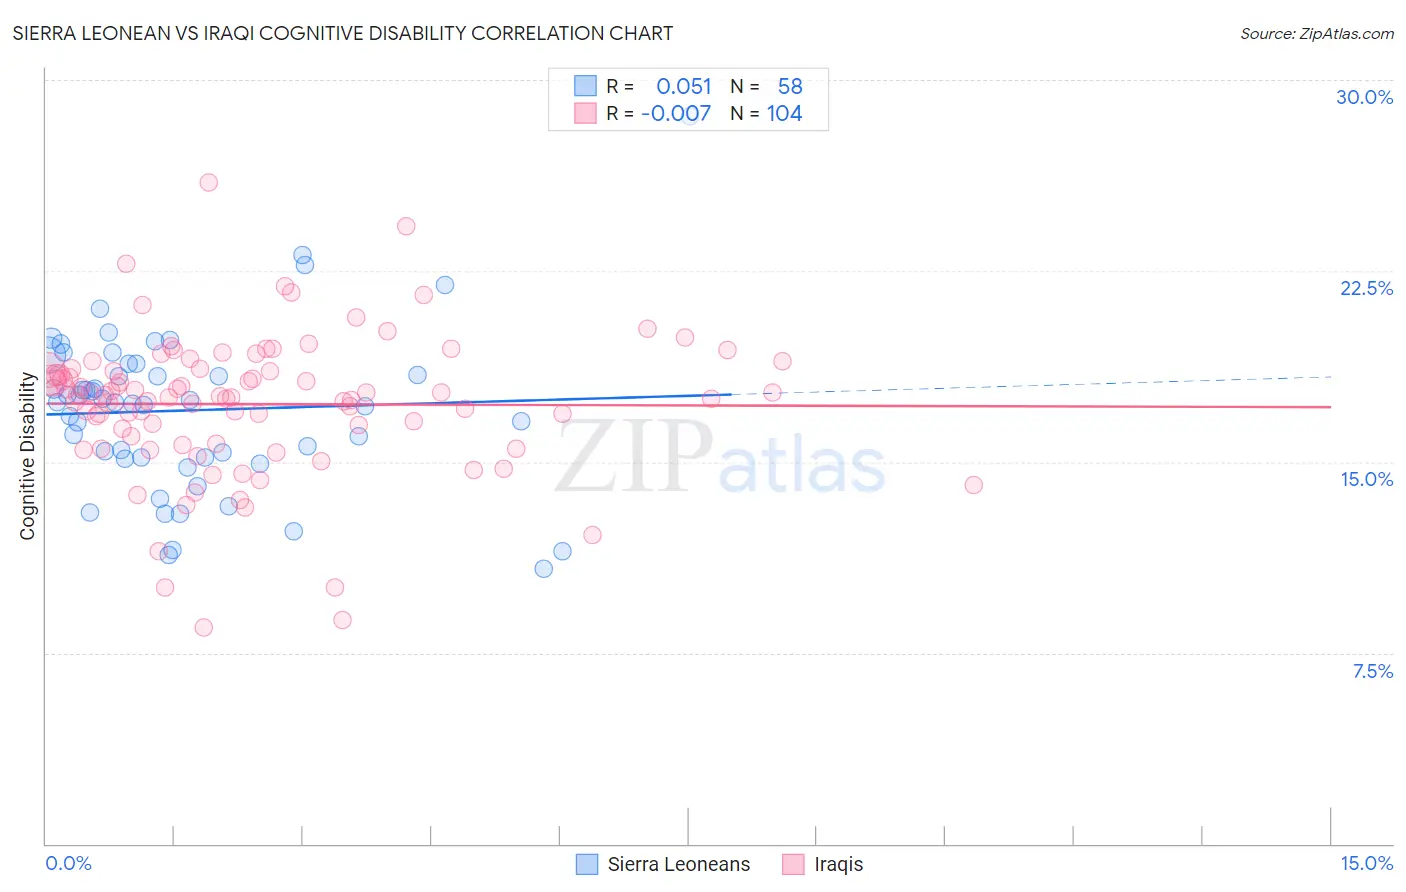
Sierra Leonean vs Iraqi Cognitive Disability Correlation Chart
The statistical analysis conducted on geographies consisting of 83,361,112 people shows a slight positive correlation between the proportion of Sierra Leoneans and percentage of population with cognitive disability in the United States with a correlation coefficient (R) of 0.051 and weighted average of 17.9%. Similarly, the statistical analysis conducted on geographies consisting of 170,645,989 people shows no correlation between the proportion of Iraqis and percentage of population with cognitive disability in the United States with a correlation coefficient (R) of -0.007 and weighted average of 17.8%, a difference of 0.78%.
Cognitive Disability Correlation Summary
| Measurement | Sierra Leonean | Iraqi |
| Minimum | 10.8% | 8.5% |
| Maximum | 28.6% | 25.9% |
| Range | 17.8% | 17.5% |
| Mean | 17.0% | 17.3% |
| Median | 17.3% | 17.6% |
| Interquartile 25% (IQ1) | 15.2% | 15.8% |
| Interquartile 75% (IQ3) | 18.8% | 18.6% |
| Interquartile Range (IQR) | 3.7% | 2.8% |
| Standard Deviation (Sample) | 3.2% | 2.8% |
| Standard Deviation (Population) | 3.2% | 2.8% |
Similar Demographics by Cognitive Disability
Demographics Similar to Sierra Leoneans by Cognitive Disability
In terms of cognitive disability, the demographic groups most similar to Sierra Leoneans are Guamanian/Chamorro (17.9%, a difference of 0.030%), Immigrants from Barbados (17.9%, a difference of 0.040%), Immigrants from Belize (17.9%, a difference of 0.080%), Ethiopian (17.9%, a difference of 0.090%), and Menominee (18.0%, a difference of 0.10%).
| Demographics | Rating | Rank | Cognitive Disability |
| Immigrants | Azores | 0.6 /100 | #255 | Tragic 17.9% |
| Bahamians | 0.6 /100 | #256 | Tragic 17.9% |
| Mexican American Indians | 0.6 /100 | #257 | Tragic 17.9% |
| Immigrants | Armenia | 0.6 /100 | #258 | Tragic 17.9% |
| Ethiopians | 0.5 /100 | #259 | Tragic 17.9% |
| Immigrants | Belize | 0.5 /100 | #260 | Tragic 17.9% |
| Guamanians/Chamorros | 0.5 /100 | #261 | Tragic 17.9% |
| Sierra Leoneans | 0.4 /100 | #262 | Tragic 17.9% |
| Immigrants | Barbados | 0.4 /100 | #263 | Tragic 17.9% |
| Menominee | 0.4 /100 | #264 | Tragic 18.0% |
| Spanish Americans | 0.4 /100 | #265 | Tragic 18.0% |
| Belizeans | 0.4 /100 | #266 | Tragic 18.0% |
| Nepalese | 0.3 /100 | #267 | Tragic 18.0% |
| Cherokee | 0.3 /100 | #268 | Tragic 18.0% |
| Hondurans | 0.3 /100 | #269 | Tragic 18.0% |
Demographics Similar to Iraqis by Cognitive Disability
In terms of cognitive disability, the demographic groups most similar to Iraqis are Cajun (17.8%, a difference of 0.040%), Mexican (17.8%, a difference of 0.14%), Cheyenne (17.8%, a difference of 0.16%), Paiute (17.8%, a difference of 0.16%), and Immigrants from Mexico (17.8%, a difference of 0.20%).
| Demographics | Rating | Rank | Cognitive Disability |
| Panamanians | 2.1 /100 | #233 | Tragic 17.8% |
| Osage | 2.0 /100 | #234 | Tragic 17.8% |
| Spanish American Indians | 2.0 /100 | #235 | Tragic 17.8% |
| Immigrants | Iraq | 1.8 /100 | #236 | Tragic 17.8% |
| Immigrants | Mexico | 1.8 /100 | #237 | Tragic 17.8% |
| Cheyenne | 1.7 /100 | #238 | Tragic 17.8% |
| Cajuns | 1.4 /100 | #239 | Tragic 17.8% |
| Iraqis | 1.4 /100 | #240 | Tragic 17.8% |
| Mexicans | 1.1 /100 | #241 | Tragic 17.8% |
| Paiute | 1.1 /100 | #242 | Tragic 17.8% |
| Immigrants | Bangladesh | 1.0 /100 | #243 | Tragic 17.8% |
| Jamaicans | 0.9 /100 | #244 | Tragic 17.9% |
| Trinidadians and Tobagonians | 0.8 /100 | #245 | Tragic 17.9% |
| Immigrants | Thailand | 0.8 /100 | #246 | Tragic 17.9% |
| Samoans | 0.7 /100 | #247 | Tragic 17.9% |