Sierra Leonean vs Immigrants from Western Europe Cognitive Disability
COMPARE
Sierra Leonean
Immigrants from Western Europe
Cognitive Disability
Cognitive Disability Comparison
Sierra Leoneans
Immigrants from Western Europe
17.9%
COGNITIVE DISABILITY
0.4/ 100
METRIC RATING
262nd/ 347
METRIC RANK
16.9%
COGNITIVE DISABILITY
94.8/ 100
METRIC RATING
122nd/ 347
METRIC RANK
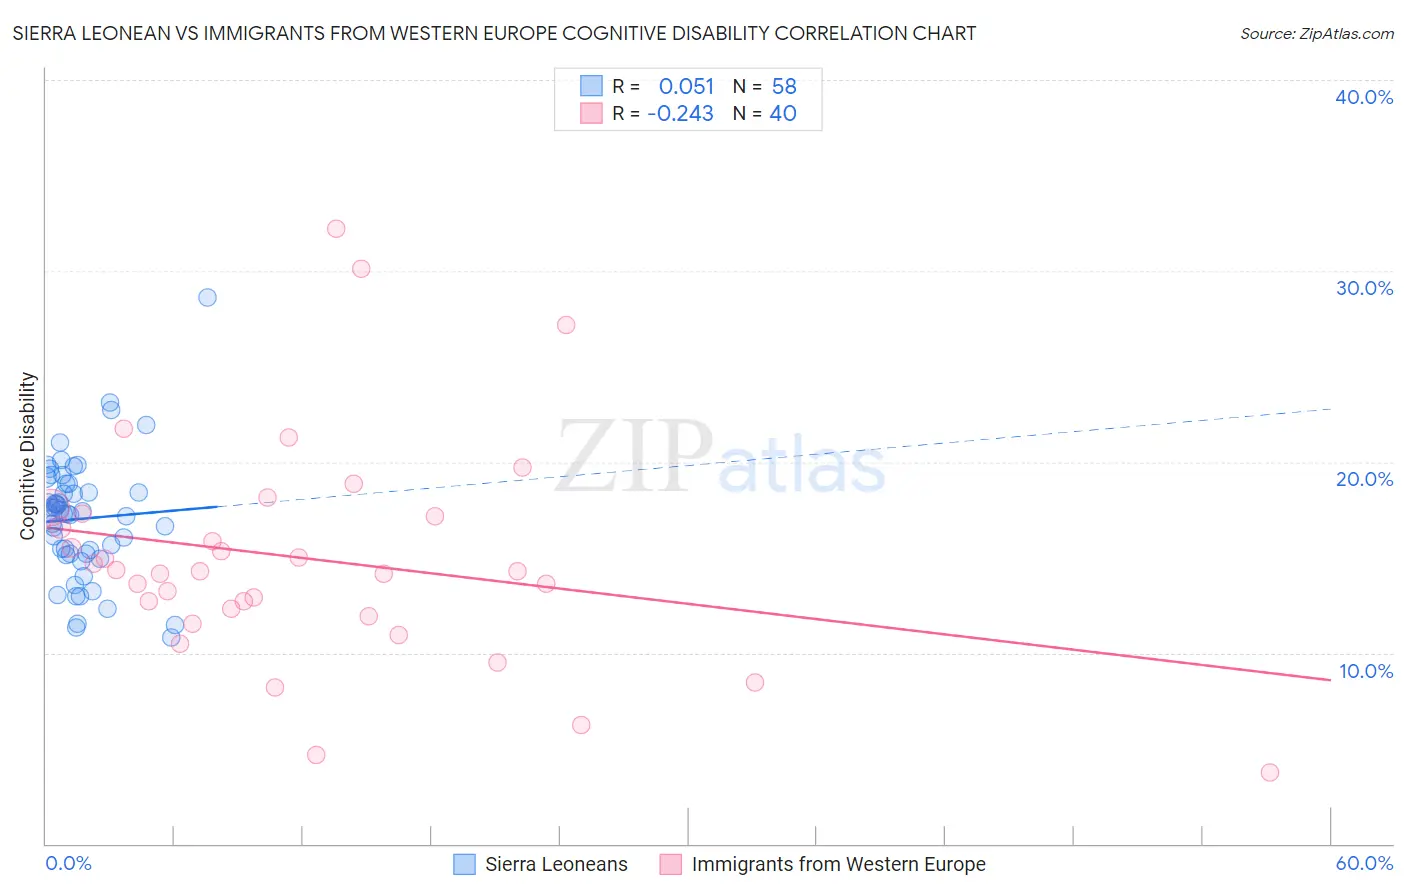
Sierra Leonean vs Immigrants from Western Europe Cognitive Disability Correlation Chart
The statistical analysis conducted on geographies consisting of 83,361,112 people shows a slight positive correlation between the proportion of Sierra Leoneans and percentage of population with cognitive disability in the United States with a correlation coefficient (R) of 0.051 and weighted average of 17.9%. Similarly, the statistical analysis conducted on geographies consisting of 494,034,294 people shows a weak negative correlation between the proportion of Immigrants from Western Europe and percentage of population with cognitive disability in the United States with a correlation coefficient (R) of -0.243 and weighted average of 16.9%, a difference of 6.0%.
Cognitive Disability Correlation Summary
| Measurement | Sierra Leonean | Immigrants from Western Europe |
| Minimum | 10.8% | 3.8% |
| Maximum | 28.6% | 32.2% |
| Range | 17.8% | 28.4% |
| Mean | 17.0% | 14.9% |
| Median | 17.3% | 14.3% |
| Interquartile 25% (IQ1) | 15.2% | 12.1% |
| Interquartile 75% (IQ3) | 18.8% | 17.2% |
| Interquartile Range (IQR) | 3.7% | 5.1% |
| Standard Deviation (Sample) | 3.2% | 5.9% |
| Standard Deviation (Population) | 3.2% | 5.8% |
Similar Demographics by Cognitive Disability
Demographics Similar to Sierra Leoneans by Cognitive Disability
In terms of cognitive disability, the demographic groups most similar to Sierra Leoneans are Guamanian/Chamorro (17.9%, a difference of 0.030%), Immigrants from Barbados (17.9%, a difference of 0.040%), Immigrants from Belize (17.9%, a difference of 0.080%), Ethiopian (17.9%, a difference of 0.090%), and Menominee (18.0%, a difference of 0.10%).
| Demographics | Rating | Rank | Cognitive Disability |
| Immigrants | Azores | 0.6 /100 | #255 | Tragic 17.9% |
| Bahamians | 0.6 /100 | #256 | Tragic 17.9% |
| Mexican American Indians | 0.6 /100 | #257 | Tragic 17.9% |
| Immigrants | Armenia | 0.6 /100 | #258 | Tragic 17.9% |
| Ethiopians | 0.5 /100 | #259 | Tragic 17.9% |
| Immigrants | Belize | 0.5 /100 | #260 | Tragic 17.9% |
| Guamanians/Chamorros | 0.5 /100 | #261 | Tragic 17.9% |
| Sierra Leoneans | 0.4 /100 | #262 | Tragic 17.9% |
| Immigrants | Barbados | 0.4 /100 | #263 | Tragic 17.9% |
| Menominee | 0.4 /100 | #264 | Tragic 18.0% |
| Spanish Americans | 0.4 /100 | #265 | Tragic 18.0% |
| Belizeans | 0.4 /100 | #266 | Tragic 18.0% |
| Nepalese | 0.3 /100 | #267 | Tragic 18.0% |
| Cherokee | 0.3 /100 | #268 | Tragic 18.0% |
| Hondurans | 0.3 /100 | #269 | Tragic 18.0% |
Demographics Similar to Immigrants from Western Europe by Cognitive Disability
In terms of cognitive disability, the demographic groups most similar to Immigrants from Western Europe are Portuguese (16.9%, a difference of 0.010%), Immigrants from China (16.9%, a difference of 0.020%), Scottish (16.9%, a difference of 0.030%), Turkish (16.9%, a difference of 0.030%), and Scandinavian (16.9%, a difference of 0.090%).
| Demographics | Rating | Rank | Cognitive Disability |
| Yup'ik | 96.9 /100 | #115 | Exceptional 16.9% |
| Inupiat | 96.5 /100 | #116 | Exceptional 16.9% |
| Immigrants | Japan | 96.2 /100 | #117 | Exceptional 16.9% |
| Immigrants | Denmark | 96.2 /100 | #118 | Exceptional 16.9% |
| South Africans | 95.5 /100 | #119 | Exceptional 16.9% |
| Scottish | 95.0 /100 | #120 | Exceptional 16.9% |
| Immigrants | China | 94.9 /100 | #121 | Exceptional 16.9% |
| Immigrants | Western Europe | 94.8 /100 | #122 | Exceptional 16.9% |
| Portuguese | 94.7 /100 | #123 | Exceptional 16.9% |
| Turks | 94.5 /100 | #124 | Exceptional 16.9% |
| Scandinavians | 94.1 /100 | #125 | Exceptional 16.9% |
| Europeans | 93.4 /100 | #126 | Exceptional 17.0% |
| Immigrants | Costa Rica | 93.1 /100 | #127 | Exceptional 17.0% |
| Nicaraguans | 93.0 /100 | #128 | Exceptional 17.0% |
| Immigrants | Uruguay | 92.9 /100 | #129 | Exceptional 17.0% |