Sierra Leonean vs Immigrants from Croatia Cognitive Disability
COMPARE
Sierra Leonean
Immigrants from Croatia
Cognitive Disability
Cognitive Disability Comparison
Sierra Leoneans
Immigrants from Croatia
17.9%
COGNITIVE DISABILITY
0.4/ 100
METRIC RATING
262nd/ 347
METRIC RANK
16.4%
COGNITIVE DISABILITY
99.9/ 100
METRIC RATING
26th/ 347
METRIC RANK
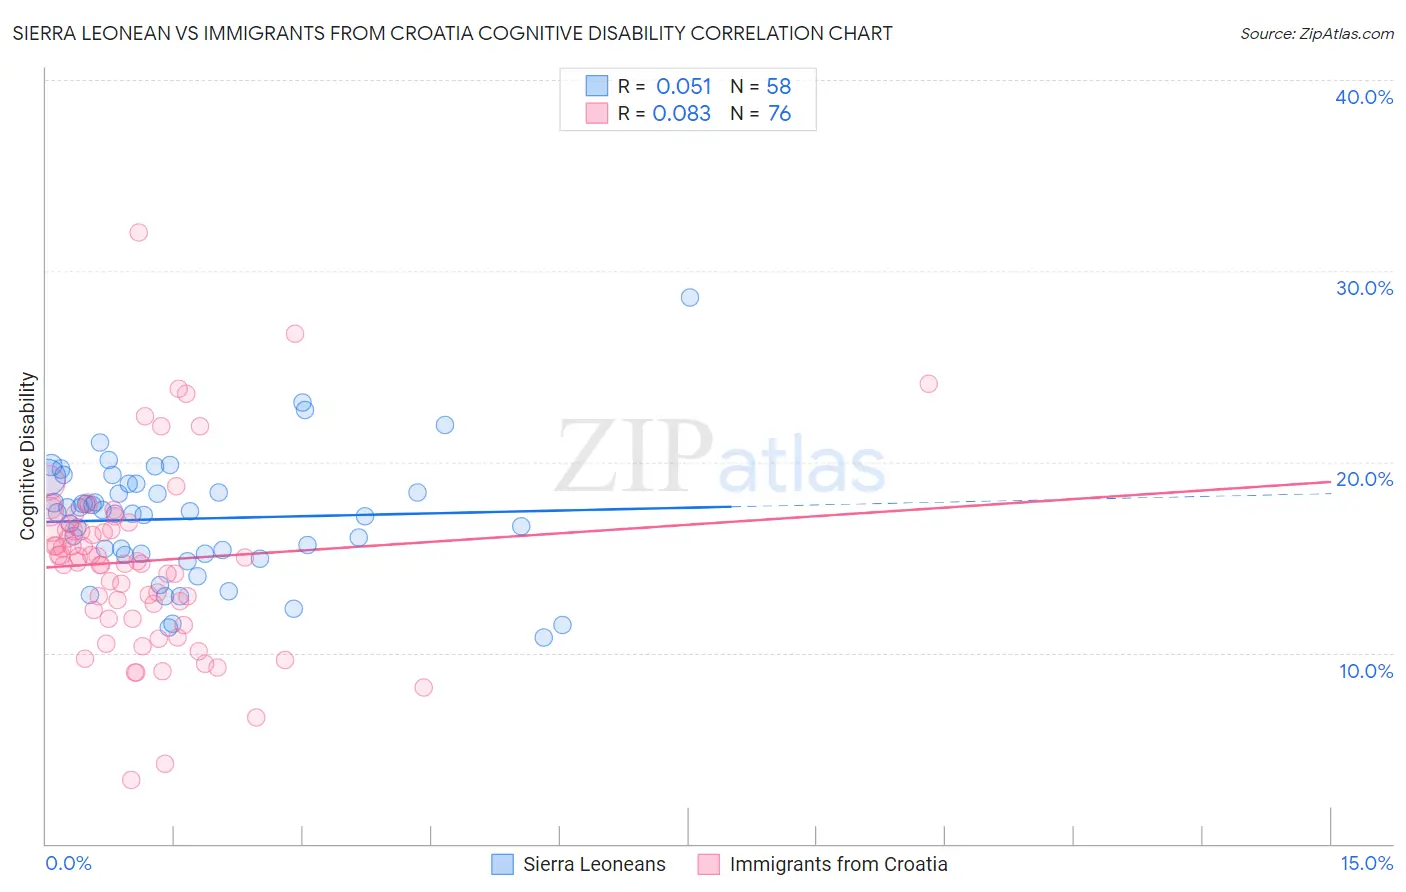
Sierra Leonean vs Immigrants from Croatia Cognitive Disability Correlation Chart
The statistical analysis conducted on geographies consisting of 83,361,112 people shows a slight positive correlation between the proportion of Sierra Leoneans and percentage of population with cognitive disability in the United States with a correlation coefficient (R) of 0.051 and weighted average of 17.9%. Similarly, the statistical analysis conducted on geographies consisting of 132,576,983 people shows a slight positive correlation between the proportion of Immigrants from Croatia and percentage of population with cognitive disability in the United States with a correlation coefficient (R) of 0.083 and weighted average of 16.4%, a difference of 9.5%.
Cognitive Disability Correlation Summary
| Measurement | Sierra Leonean | Immigrants from Croatia |
| Minimum | 10.8% | 3.4% |
| Maximum | 28.6% | 32.0% |
| Range | 17.8% | 28.6% |
| Mean | 17.0% | 14.8% |
| Median | 17.3% | 14.9% |
| Interquartile 25% (IQ1) | 15.2% | 12.0% |
| Interquartile 75% (IQ3) | 18.8% | 16.6% |
| Interquartile Range (IQR) | 3.7% | 4.6% |
| Standard Deviation (Sample) | 3.2% | 4.7% |
| Standard Deviation (Population) | 3.2% | 4.7% |
Similar Demographics by Cognitive Disability
Demographics Similar to Sierra Leoneans by Cognitive Disability
In terms of cognitive disability, the demographic groups most similar to Sierra Leoneans are Guamanian/Chamorro (17.9%, a difference of 0.030%), Immigrants from Barbados (17.9%, a difference of 0.040%), Immigrants from Belize (17.9%, a difference of 0.080%), Ethiopian (17.9%, a difference of 0.090%), and Menominee (18.0%, a difference of 0.10%).
| Demographics | Rating | Rank | Cognitive Disability |
| Immigrants | Azores | 0.6 /100 | #255 | Tragic 17.9% |
| Bahamians | 0.6 /100 | #256 | Tragic 17.9% |
| Mexican American Indians | 0.6 /100 | #257 | Tragic 17.9% |
| Immigrants | Armenia | 0.6 /100 | #258 | Tragic 17.9% |
| Ethiopians | 0.5 /100 | #259 | Tragic 17.9% |
| Immigrants | Belize | 0.5 /100 | #260 | Tragic 17.9% |
| Guamanians/Chamorros | 0.5 /100 | #261 | Tragic 17.9% |
| Sierra Leoneans | 0.4 /100 | #262 | Tragic 17.9% |
| Immigrants | Barbados | 0.4 /100 | #263 | Tragic 17.9% |
| Menominee | 0.4 /100 | #264 | Tragic 18.0% |
| Spanish Americans | 0.4 /100 | #265 | Tragic 18.0% |
| Belizeans | 0.4 /100 | #266 | Tragic 18.0% |
| Nepalese | 0.3 /100 | #267 | Tragic 18.0% |
| Cherokee | 0.3 /100 | #268 | Tragic 18.0% |
| Hondurans | 0.3 /100 | #269 | Tragic 18.0% |
Demographics Similar to Immigrants from Croatia by Cognitive Disability
In terms of cognitive disability, the demographic groups most similar to Immigrants from Croatia are Immigrants from Pakistan (16.4%, a difference of 0.020%), Polish (16.4%, a difference of 0.020%), Luxembourger (16.4%, a difference of 0.030%), Filipino (16.4%, a difference of 0.050%), and Czech (16.4%, a difference of 0.050%).
| Demographics | Rating | Rank | Cognitive Disability |
| Immigrants | Bolivia | 100.0 /100 | #19 | Exceptional 16.3% |
| Bulgarians | 100.0 /100 | #20 | Exceptional 16.3% |
| Immigrants | Cuba | 100.0 /100 | #21 | Exceptional 16.3% |
| Immigrants | South Central Asia | 99.9 /100 | #22 | Exceptional 16.4% |
| Croatians | 99.9 /100 | #23 | Exceptional 16.4% |
| Immigrants | Argentina | 99.9 /100 | #24 | Exceptional 16.4% |
| Luxembourgers | 99.9 /100 | #25 | Exceptional 16.4% |
| Immigrants | Croatia | 99.9 /100 | #26 | Exceptional 16.4% |
| Immigrants | Pakistan | 99.9 /100 | #27 | Exceptional 16.4% |
| Poles | 99.9 /100 | #28 | Exceptional 16.4% |
| Filipinos | 99.9 /100 | #29 | Exceptional 16.4% |
| Czechs | 99.9 /100 | #30 | Exceptional 16.4% |
| Immigrants | Romania | 99.9 /100 | #31 | Exceptional 16.4% |
| Immigrants | Israel | 99.9 /100 | #32 | Exceptional 16.4% |
| Italians | 99.9 /100 | #33 | Exceptional 16.4% |