Shoshone vs Tongan Vision Disability
COMPARE
Shoshone
Tongan
Vision Disability
Vision Disability Comparison
Shoshone
Tongans
2.7%
VISION DISABILITY
0.0/ 100
METRIC RATING
316th/ 347
METRIC RANK
2.0%
VISION DISABILITY
99.5/ 100
METRIC RATING
51st/ 347
METRIC RANK
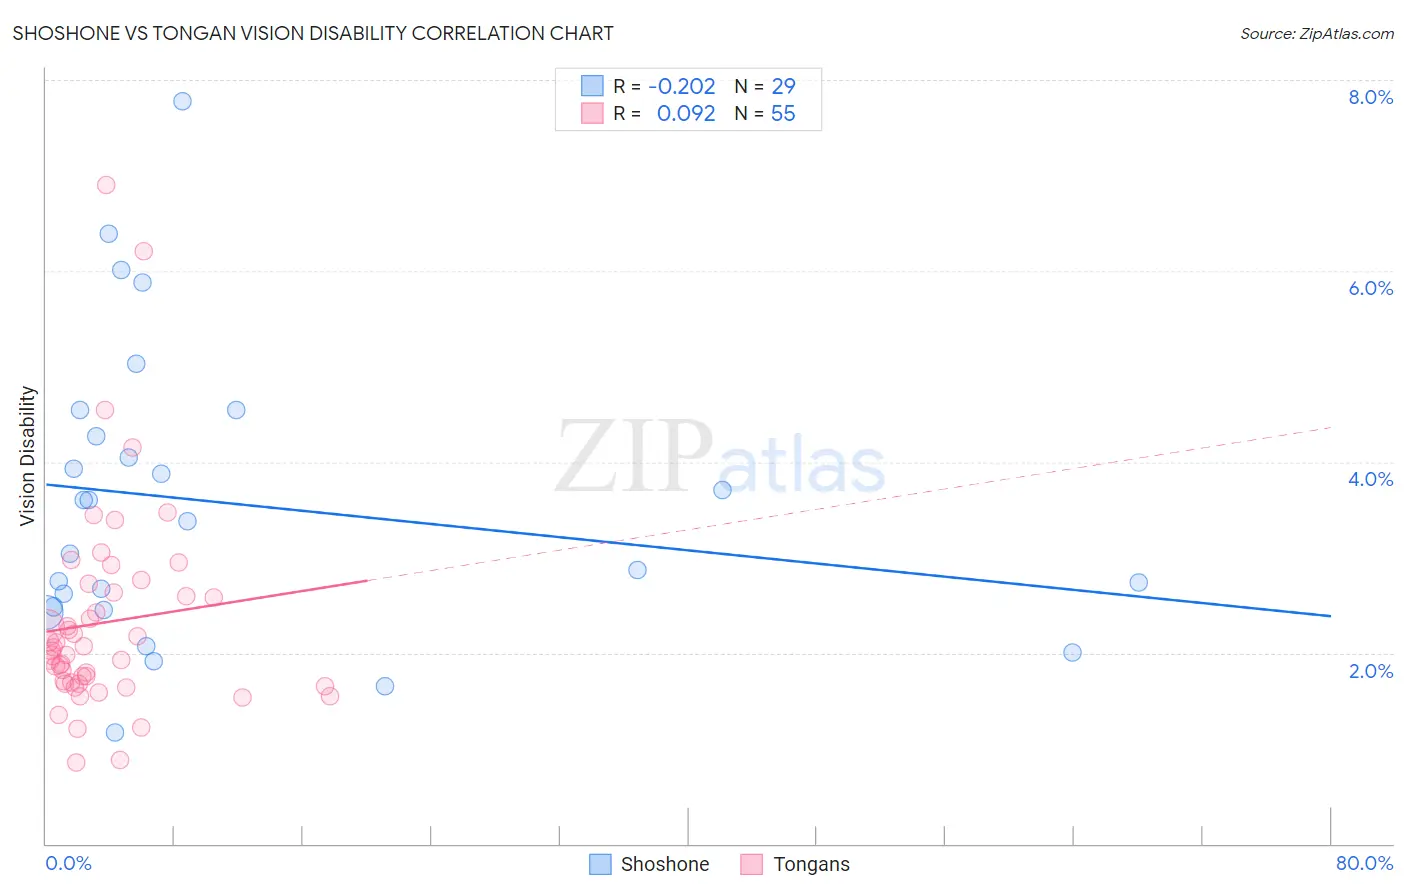
Shoshone vs Tongan Vision Disability Correlation Chart
The statistical analysis conducted on geographies consisting of 66,614,475 people shows a weak negative correlation between the proportion of Shoshone and percentage of population with vision disability in the United States with a correlation coefficient (R) of -0.202 and weighted average of 2.7%. Similarly, the statistical analysis conducted on geographies consisting of 102,891,232 people shows a slight positive correlation between the proportion of Tongans and percentage of population with vision disability in the United States with a correlation coefficient (R) of 0.092 and weighted average of 2.0%, a difference of 35.6%.
Vision Disability Correlation Summary
| Measurement | Shoshone | Tongan |
| Minimum | 1.2% | 0.85% |
| Maximum | 7.8% | 6.9% |
| Range | 6.6% | 6.1% |
| Mean | 3.6% | 2.3% |
| Median | 3.4% | 2.0% |
| Interquartile 25% (IQ1) | 2.5% | 1.7% |
| Interquartile 75% (IQ3) | 4.4% | 2.6% |
| Interquartile Range (IQR) | 1.9% | 0.96% |
| Standard Deviation (Sample) | 1.5% | 1.1% |
| Standard Deviation (Population) | 1.5% | 1.1% |
Similar Demographics by Vision Disability
Demographics Similar to Shoshone by Vision Disability
In terms of vision disability, the demographic groups most similar to Shoshone are Yup'ik (2.7%, a difference of 0.20%), Osage (2.7%, a difference of 0.43%), Alaska Native (2.7%, a difference of 1.3%), Inupiat (2.7%, a difference of 1.6%), and Potawatomi (2.6%, a difference of 1.7%).
| Demographics | Rating | Rank | Vision Disability |
| Immigrants | Yemen | 0.0 /100 | #309 | Tragic 2.6% |
| Blackfeet | 0.0 /100 | #310 | Tragic 2.6% |
| Dominicans | 0.0 /100 | #311 | Tragic 2.6% |
| Americans | 0.0 /100 | #312 | Tragic 2.6% |
| Potawatomi | 0.0 /100 | #313 | Tragic 2.6% |
| Inupiat | 0.0 /100 | #314 | Tragic 2.7% |
| Osage | 0.0 /100 | #315 | Tragic 2.7% |
| Shoshone | 0.0 /100 | #316 | Tragic 2.7% |
| Yup'ik | 0.0 /100 | #317 | Tragic 2.7% |
| Alaska Natives | 0.0 /100 | #318 | Tragic 2.7% |
| Tohono O'odham | 0.0 /100 | #319 | Tragic 2.8% |
| Blacks/African Americans | 0.0 /100 | #320 | Tragic 2.8% |
| Comanche | 0.0 /100 | #321 | Tragic 2.8% |
| Paiute | 0.0 /100 | #322 | Tragic 2.9% |
| Tlingit-Haida | 0.0 /100 | #323 | Tragic 2.9% |
Demographics Similar to Tongans by Vision Disability
In terms of vision disability, the demographic groups most similar to Tongans are Afghan (2.0%, a difference of 0.090%), Latvian (2.0%, a difference of 0.15%), Israeli (2.0%, a difference of 0.22%), Immigrants from Serbia (2.0%, a difference of 0.31%), and Immigrants from Belarus (2.0%, a difference of 0.42%).
| Demographics | Rating | Rank | Vision Disability |
| Immigrants | Indonesia | 99.7 /100 | #44 | Exceptional 2.0% |
| Ethiopians | 99.7 /100 | #45 | Exceptional 2.0% |
| Immigrants | Sweden | 99.7 /100 | #46 | Exceptional 2.0% |
| Immigrants | Bulgaria | 99.7 /100 | #47 | Exceptional 2.0% |
| Israelis | 99.6 /100 | #48 | Exceptional 2.0% |
| Latvians | 99.5 /100 | #49 | Exceptional 2.0% |
| Afghans | 99.5 /100 | #50 | Exceptional 2.0% |
| Tongans | 99.5 /100 | #51 | Exceptional 2.0% |
| Immigrants | Serbia | 99.4 /100 | #52 | Exceptional 2.0% |
| Immigrants | Belarus | 99.3 /100 | #53 | Exceptional 2.0% |
| Macedonians | 99.3 /100 | #54 | Exceptional 2.0% |
| Laotians | 99.3 /100 | #55 | Exceptional 2.0% |
| Jordanians | 99.2 /100 | #56 | Exceptional 2.0% |
| Somalis | 99.2 /100 | #57 | Exceptional 2.0% |
| Immigrants | Saudi Arabia | 99.2 /100 | #58 | Exceptional 2.0% |