Indian (Asian) vs Tohono O'odham Disability
COMPARE
Indian (Asian)
Tohono O'odham
Disability
Disability Comparison
Indians (Asian)
Tohono O'odham
10.3%
DISABILITY
100.0/ 100
METRIC RATING
16th/ 347
METRIC RANK
14.8%
DISABILITY
0.0/ 100
METRIC RATING
335th/ 347
METRIC RANK
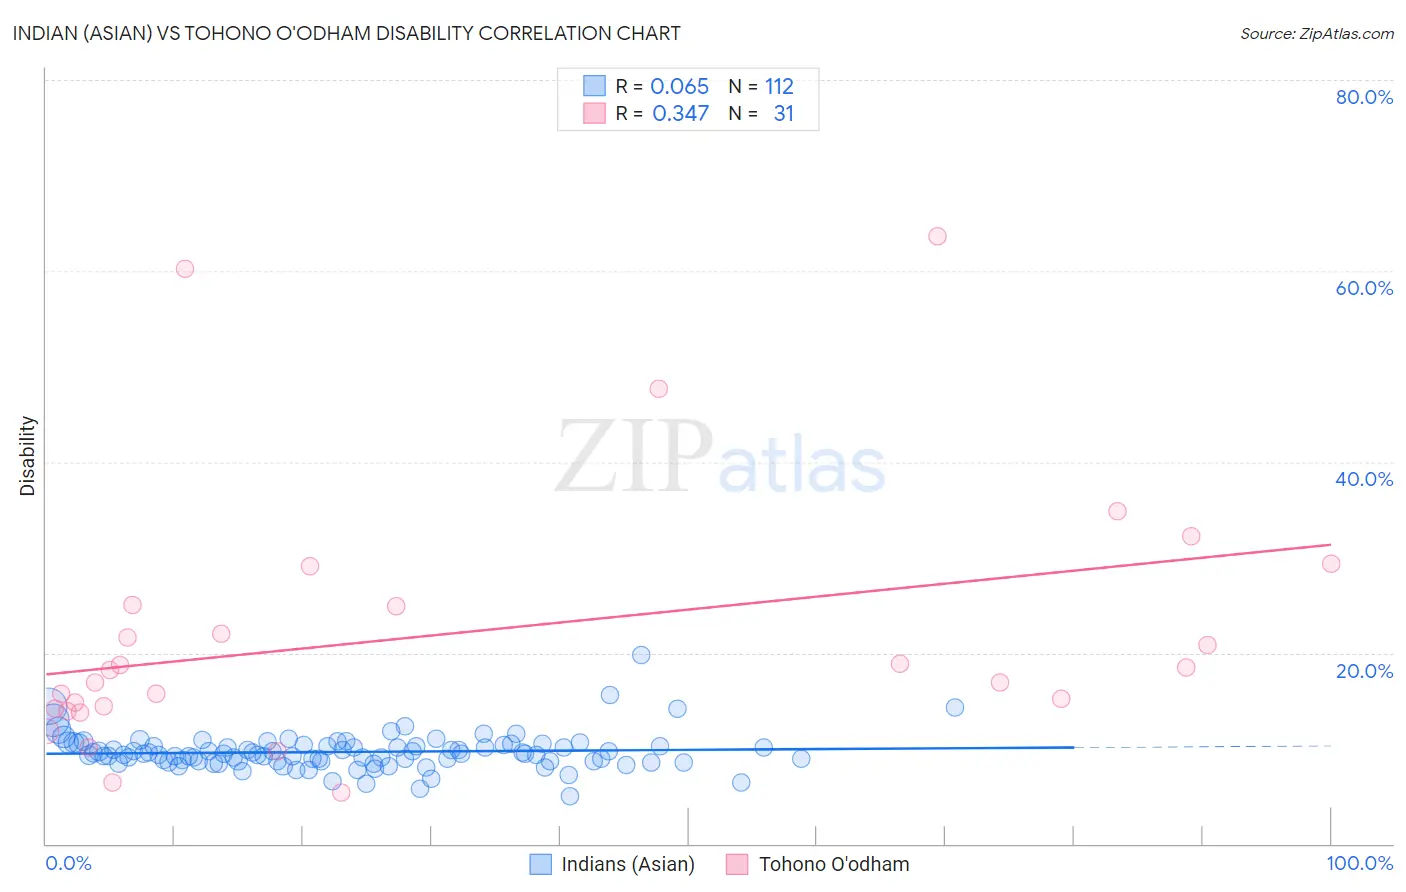
Indian (Asian) vs Tohono O'odham Disability Correlation Chart
The statistical analysis conducted on geographies consisting of 495,278,900 people shows a slight positive correlation between the proportion of Indians (Asian) and percentage of population with a disability in the United States with a correlation coefficient (R) of 0.065 and weighted average of 10.3%. Similarly, the statistical analysis conducted on geographies consisting of 58,721,793 people shows a mild positive correlation between the proportion of Tohono O'odham and percentage of population with a disability in the United States with a correlation coefficient (R) of 0.347 and weighted average of 14.8%, a difference of 44.0%.
Disability Correlation Summary
| Measurement | Indian (Asian) | Tohono O'odham |
| Minimum | 5.0% | 5.4% |
| Maximum | 19.7% | 63.6% |
| Range | 14.7% | 58.3% |
| Mean | 9.6% | 21.9% |
| Median | 9.4% | 18.2% |
| Interquartile 25% (IQ1) | 8.6% | 14.1% |
| Interquartile 75% (IQ3) | 10.3% | 25.0% |
| Interquartile Range (IQR) | 1.7% | 10.9% |
| Standard Deviation (Sample) | 1.9% | 13.8% |
| Standard Deviation (Population) | 1.9% | 13.5% |
Similar Demographics by Disability
Demographics Similar to Indians (Asian) by Disability
In terms of disability, the demographic groups most similar to Indians (Asian) are Okinawan (10.3%, a difference of 0.070%), Immigrants from Iran (10.3%, a difference of 0.070%), Immigrants from Korea (10.2%, a difference of 0.37%), Immigrants from Eastern Asia (10.2%, a difference of 0.98%), and Burmese (10.4%, a difference of 1.1%).
| Demographics | Rating | Rank | Disability |
| Immigrants | Hong Kong | 100.0 /100 | #9 | Exceptional 10.0% |
| Immigrants | China | 100.0 /100 | #10 | Exceptional 10.1% |
| Iranians | 100.0 /100 | #11 | Exceptional 10.1% |
| Immigrants | Israel | 100.0 /100 | #12 | Exceptional 10.1% |
| Immigrants | Eastern Asia | 100.0 /100 | #13 | Exceptional 10.2% |
| Immigrants | Korea | 100.0 /100 | #14 | Exceptional 10.2% |
| Okinawans | 100.0 /100 | #15 | Exceptional 10.3% |
| Indians (Asian) | 100.0 /100 | #16 | Exceptional 10.3% |
| Immigrants | Iran | 100.0 /100 | #17 | Exceptional 10.3% |
| Burmese | 100.0 /100 | #18 | Exceptional 10.4% |
| Immigrants | Pakistan | 100.0 /100 | #19 | Exceptional 10.4% |
| Immigrants | Venezuela | 100.0 /100 | #20 | Exceptional 10.4% |
| Asians | 100.0 /100 | #21 | Exceptional 10.4% |
| Immigrants | Sri Lanka | 100.0 /100 | #22 | Exceptional 10.5% |
| Immigrants | Asia | 100.0 /100 | #23 | Exceptional 10.5% |
Demographics Similar to Tohono O'odham by Disability
In terms of disability, the demographic groups most similar to Tohono O'odham are Cherokee (14.8%, a difference of 0.51%), Seminole (14.9%, a difference of 0.61%), Dutch West Indian (14.9%, a difference of 0.91%), Yuman (14.6%, a difference of 1.0%), and Cajun (14.6%, a difference of 1.2%).
| Demographics | Rating | Rank | Disability |
| Immigrants | Azores | 0.0 /100 | #328 | Tragic 14.2% |
| Potawatomi | 0.0 /100 | #329 | Tragic 14.2% |
| Navajo | 0.0 /100 | #330 | Tragic 14.3% |
| Alaskan Athabascans | 0.0 /100 | #331 | Tragic 14.4% |
| Pueblo | 0.0 /100 | #332 | Tragic 14.4% |
| Cajuns | 0.0 /100 | #333 | Tragic 14.6% |
| Yuman | 0.0 /100 | #334 | Tragic 14.6% |
| Tohono O'odham | 0.0 /100 | #335 | Tragic 14.8% |
| Cherokee | 0.0 /100 | #336 | Tragic 14.8% |
| Seminole | 0.0 /100 | #337 | Tragic 14.9% |
| Dutch West Indians | 0.0 /100 | #338 | Tragic 14.9% |
| Chickasaw | 0.0 /100 | #339 | Tragic 15.2% |
| Choctaw | 0.0 /100 | #340 | Tragic 15.4% |
| Lumbee | 0.0 /100 | #341 | Tragic 15.5% |
| Kiowa | 0.0 /100 | #342 | Tragic 15.6% |