Shoshone vs Somali Male Disability
COMPARE
Shoshone
Somali
Male Disability
Male Disability Comparison
Shoshone
Somalis
13.8%
MALE DISABILITY
0.0/ 100
METRIC RATING
321st/ 347
METRIC RANK
11.4%
MALE DISABILITY
18.2/ 100
METRIC RATING
197th/ 347
METRIC RANK
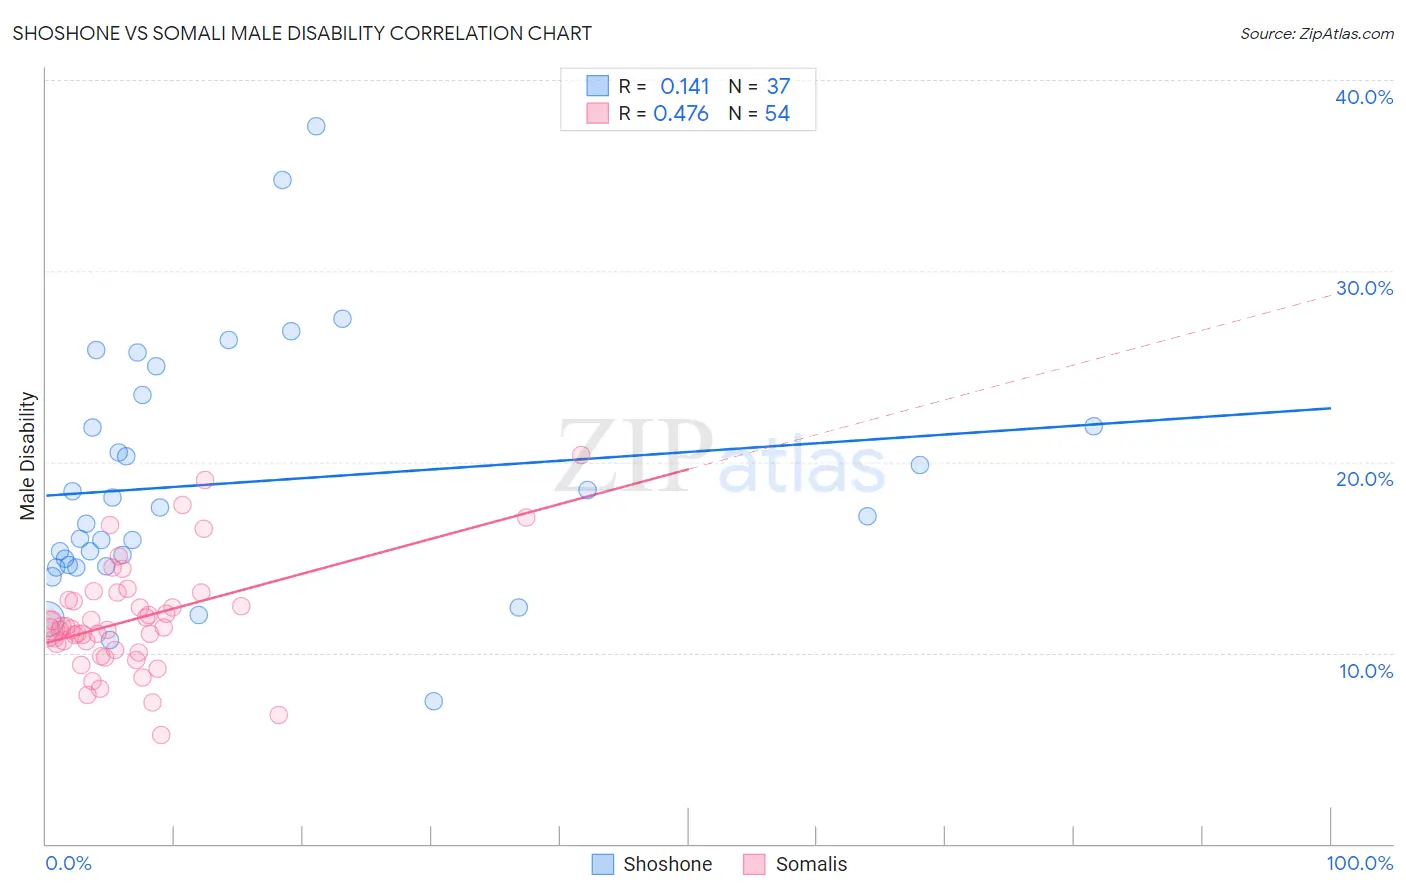
Shoshone vs Somali Male Disability Correlation Chart
The statistical analysis conducted on geographies consisting of 66,619,814 people shows a poor positive correlation between the proportion of Shoshone and percentage of males with a disability in the United States with a correlation coefficient (R) of 0.141 and weighted average of 13.8%. Similarly, the statistical analysis conducted on geographies consisting of 99,314,989 people shows a moderate positive correlation between the proportion of Somalis and percentage of males with a disability in the United States with a correlation coefficient (R) of 0.476 and weighted average of 11.4%, a difference of 20.9%.
Male Disability Correlation Summary
| Measurement | Shoshone | Somali |
| Minimum | 7.4% | 5.7% |
| Maximum | 37.6% | 20.4% |
| Range | 30.1% | 14.6% |
| Mean | 18.9% | 11.8% |
| Median | 17.1% | 11.2% |
| Interquartile 25% (IQ1) | 14.6% | 10.1% |
| Interquartile 75% (IQ3) | 22.7% | 12.7% |
| Interquartile Range (IQR) | 8.1% | 2.6% |
| Standard Deviation (Sample) | 6.5% | 2.9% |
| Standard Deviation (Population) | 6.4% | 2.9% |
Similar Demographics by Male Disability
Demographics Similar to Shoshone by Male Disability
In terms of male disability, the demographic groups most similar to Shoshone are Tlingit-Haida (13.8%, a difference of 0.050%), American (13.8%, a difference of 0.54%), Cree (13.7%, a difference of 0.96%), Apache (14.0%, a difference of 1.1%), and Paiute (13.7%, a difference of 1.2%).
| Demographics | Rating | Rank | Male Disability |
| Aleuts | 0.0 /100 | #314 | Tragic 13.5% |
| Iroquois | 0.0 /100 | #315 | Tragic 13.6% |
| Alaska Natives | 0.0 /100 | #316 | Tragic 13.6% |
| Paiute | 0.0 /100 | #317 | Tragic 13.7% |
| Cree | 0.0 /100 | #318 | Tragic 13.7% |
| Americans | 0.0 /100 | #319 | Tragic 13.8% |
| Tlingit-Haida | 0.0 /100 | #320 | Tragic 13.8% |
| Shoshone | 0.0 /100 | #321 | Tragic 13.8% |
| Apache | 0.0 /100 | #322 | Tragic 14.0% |
| Osage | 0.0 /100 | #323 | Tragic 14.0% |
| Comanche | 0.0 /100 | #324 | Tragic 14.1% |
| Ottawa | 0.0 /100 | #325 | Tragic 14.1% |
| Natives/Alaskans | 0.0 /100 | #326 | Tragic 14.2% |
| Potawatomi | 0.0 /100 | #327 | Tragic 14.2% |
| Chippewa | 0.0 /100 | #328 | Tragic 14.3% |
Demographics Similar to Somalis by Male Disability
In terms of male disability, the demographic groups most similar to Somalis are West Indian (11.4%, a difference of 0.020%), Immigrants from Jamaica (11.5%, a difference of 0.18%), Immigrants from Oceania (11.4%, a difference of 0.23%), Belizean (11.4%, a difference of 0.26%), and Lebanese (11.5%, a difference of 0.27%).
| Demographics | Rating | Rank | Male Disability |
| Immigrants | Bosnia and Herzegovina | 25.4 /100 | #190 | Fair 11.4% |
| Senegalese | 23.2 /100 | #191 | Fair 11.4% |
| Assyrians/Chaldeans/Syriacs | 23.2 /100 | #192 | Fair 11.4% |
| Greeks | 22.2 /100 | #193 | Fair 11.4% |
| Belizeans | 21.2 /100 | #194 | Fair 11.4% |
| Immigrants | Oceania | 20.9 /100 | #195 | Fair 11.4% |
| West Indians | 18.4 /100 | #196 | Poor 11.4% |
| Somalis | 18.2 /100 | #197 | Poor 11.4% |
| Immigrants | Jamaica | 16.3 /100 | #198 | Poor 11.5% |
| Lebanese | 15.4 /100 | #199 | Poor 11.5% |
| Immigrants | Iraq | 13.0 /100 | #200 | Poor 11.5% |
| Immigrants | Panama | 13.0 /100 | #201 | Poor 11.5% |
| Immigrants | Mexico | 12.6 /100 | #202 | Poor 11.5% |
| Jamaicans | 10.9 /100 | #203 | Poor 11.5% |
| Immigrants | Cambodia | 10.8 /100 | #204 | Poor 11.5% |