Shoshone vs Immigrants from Scotland Male Disability
COMPARE
Shoshone
Immigrants from Scotland
Male Disability
Male Disability Comparison
Shoshone
Immigrants from Scotland
13.8%
MALE DISABILITY
0.0/ 100
METRIC RATING
321st/ 347
METRIC RANK
11.6%
MALE DISABILITY
8.2/ 100
METRIC RATING
212th/ 347
METRIC RANK
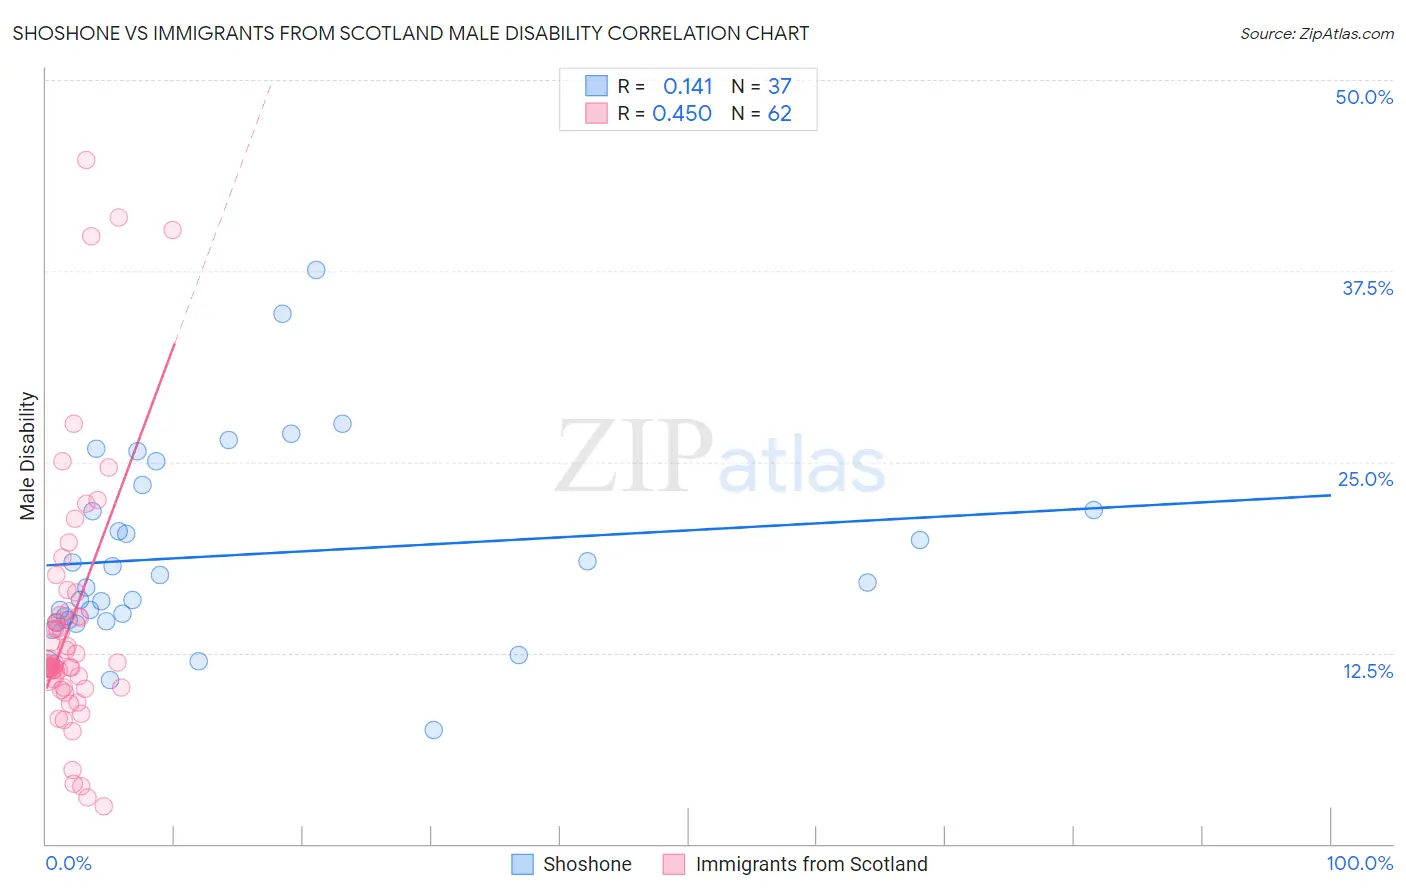
Shoshone vs Immigrants from Scotland Male Disability Correlation Chart
The statistical analysis conducted on geographies consisting of 66,619,814 people shows a poor positive correlation between the proportion of Shoshone and percentage of males with a disability in the United States with a correlation coefficient (R) of 0.141 and weighted average of 13.8%. Similarly, the statistical analysis conducted on geographies consisting of 196,397,842 people shows a moderate positive correlation between the proportion of Immigrants from Scotland and percentage of males with a disability in the United States with a correlation coefficient (R) of 0.450 and weighted average of 11.6%, a difference of 19.5%.
Male Disability Correlation Summary
| Measurement | Shoshone | Immigrants from Scotland |
| Minimum | 7.4% | 2.5% |
| Maximum | 37.6% | 44.8% |
| Range | 30.1% | 42.3% |
| Mean | 18.9% | 14.6% |
| Median | 17.1% | 11.7% |
| Interquartile 25% (IQ1) | 14.6% | 10.3% |
| Interquartile 75% (IQ3) | 22.7% | 15.2% |
| Interquartile Range (IQR) | 8.1% | 5.0% |
| Standard Deviation (Sample) | 6.5% | 8.7% |
| Standard Deviation (Population) | 6.4% | 8.6% |
Similar Demographics by Male Disability
Demographics Similar to Shoshone by Male Disability
In terms of male disability, the demographic groups most similar to Shoshone are Tlingit-Haida (13.8%, a difference of 0.050%), American (13.8%, a difference of 0.54%), Cree (13.7%, a difference of 0.96%), Apache (14.0%, a difference of 1.1%), and Paiute (13.7%, a difference of 1.2%).
| Demographics | Rating | Rank | Male Disability |
| Aleuts | 0.0 /100 | #314 | Tragic 13.5% |
| Iroquois | 0.0 /100 | #315 | Tragic 13.6% |
| Alaska Natives | 0.0 /100 | #316 | Tragic 13.6% |
| Paiute | 0.0 /100 | #317 | Tragic 13.7% |
| Cree | 0.0 /100 | #318 | Tragic 13.7% |
| Americans | 0.0 /100 | #319 | Tragic 13.8% |
| Tlingit-Haida | 0.0 /100 | #320 | Tragic 13.8% |
| Shoshone | 0.0 /100 | #321 | Tragic 13.8% |
| Apache | 0.0 /100 | #322 | Tragic 14.0% |
| Osage | 0.0 /100 | #323 | Tragic 14.0% |
| Comanche | 0.0 /100 | #324 | Tragic 14.1% |
| Ottawa | 0.0 /100 | #325 | Tragic 14.1% |
| Natives/Alaskans | 0.0 /100 | #326 | Tragic 14.2% |
| Potawatomi | 0.0 /100 | #327 | Tragic 14.2% |
| Chippewa | 0.0 /100 | #328 | Tragic 14.3% |
Demographics Similar to Immigrants from Scotland by Male Disability
In terms of male disability, the demographic groups most similar to Immigrants from Scotland are Immigrants from Thailand (11.6%, a difference of 0.030%), Mexican American Indian (11.6%, a difference of 0.080%), Ute (11.6%, a difference of 0.20%), Spanish American Indian (11.6%, a difference of 0.30%), and Icelander (11.6%, a difference of 0.31%).
| Demographics | Rating | Rank | Male Disability |
| Serbians | 10.7 /100 | #205 | Poor 11.5% |
| Ukrainians | 10.6 /100 | #206 | Poor 11.5% |
| Immigrants | Somalia | 10.4 /100 | #207 | Poor 11.5% |
| Icelanders | 10.1 /100 | #208 | Poor 11.6% |
| Spanish American Indians | 10.1 /100 | #209 | Poor 11.6% |
| Ute | 9.4 /100 | #210 | Tragic 11.6% |
| Immigrants | Thailand | 8.4 /100 | #211 | Tragic 11.6% |
| Immigrants | Scotland | 8.2 /100 | #212 | Tragic 11.6% |
| Mexican American Indians | 7.8 /100 | #213 | Tragic 11.6% |
| Lithuanians | 6.6 /100 | #214 | Tragic 11.6% |
| Indonesians | 5.9 /100 | #215 | Tragic 11.6% |
| Immigrants | Dominican Republic | 4.9 /100 | #216 | Tragic 11.7% |
| Immigrants | Dominica | 4.6 /100 | #217 | Tragic 11.7% |
| Immigrants | England | 4.0 /100 | #218 | Tragic 11.7% |
| Panamanians | 3.8 /100 | #219 | Tragic 11.7% |