Shoshone vs Somali 12th Grade, No Diploma
COMPARE
Shoshone
Somali
12th Grade, No Diploma
12th Grade, No Diploma Comparison
Shoshone
Somalis
90.5%
12TH GRADE, NO DIPLOMA
7.5/ 100
METRIC RATING
216th/ 347
METRIC RANK
90.6%
12TH GRADE, NO DIPLOMA
10.2/ 100
METRIC RATING
212th/ 347
METRIC RANK
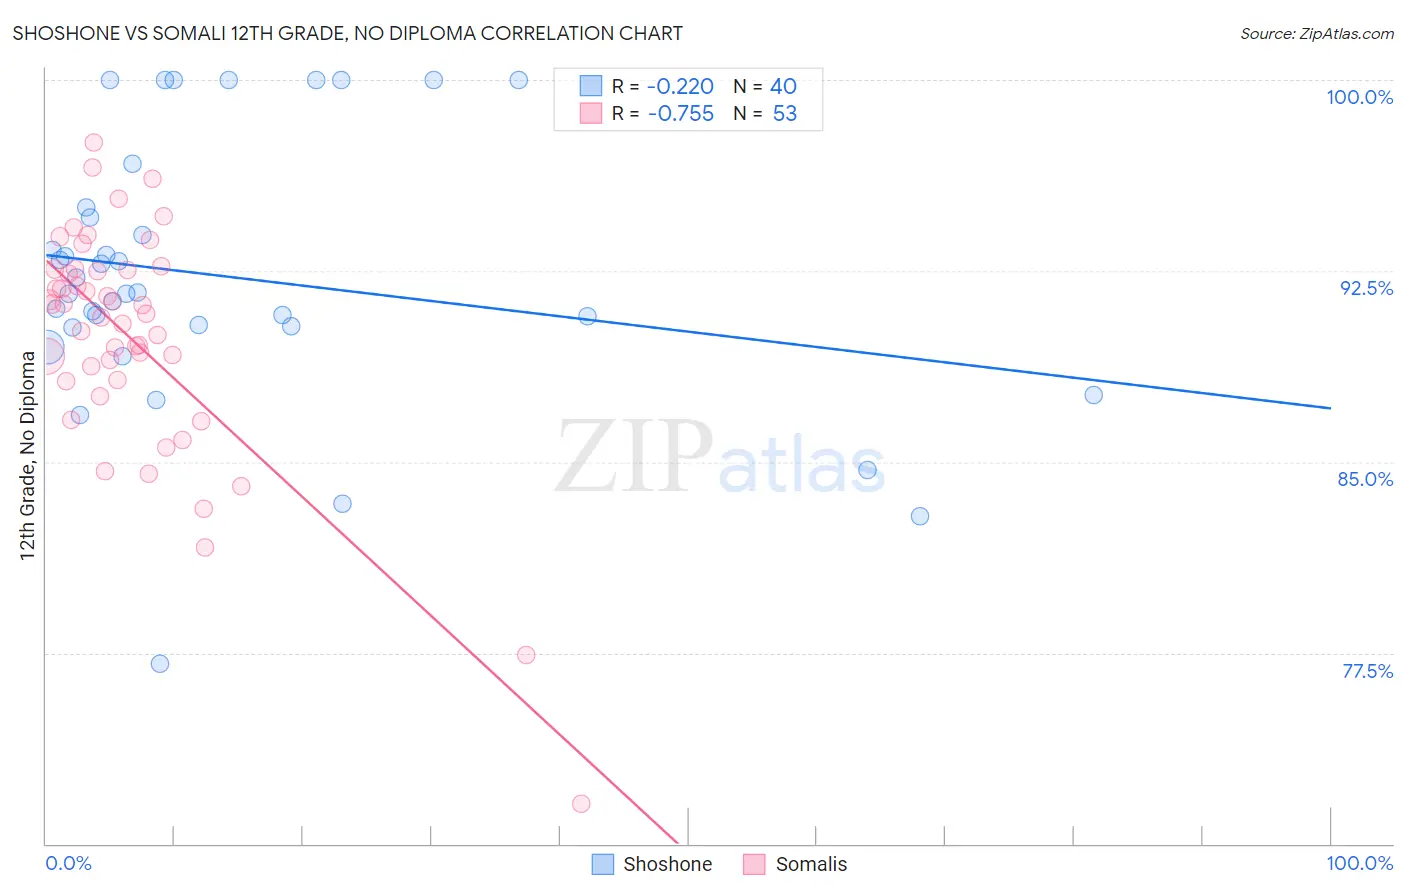
Shoshone vs Somali 12th Grade, No Diploma Correlation Chart
The statistical analysis conducted on geographies consisting of 66,627,351 people shows a weak negative correlation between the proportion of Shoshone and percentage of population with at least 12th grade (no diploma) education in the United States with a correlation coefficient (R) of -0.220 and weighted average of 90.5%. Similarly, the statistical analysis conducted on geographies consisting of 99,330,527 people shows a strong negative correlation between the proportion of Somalis and percentage of population with at least 12th grade (no diploma) education in the United States with a correlation coefficient (R) of -0.755 and weighted average of 90.6%, a difference of 0.11%.
12th Grade, No Diploma Correlation Summary
| Measurement | Shoshone | Somali |
| Minimum | 77.1% | 71.6% |
| Maximum | 100.0% | 97.6% |
| Range | 22.9% | 26.0% |
| Mean | 92.3% | 89.8% |
| Median | 91.6% | 90.8% |
| Interquartile 25% (IQ1) | 90.3% | 88.2% |
| Interquartile 75% (IQ3) | 94.8% | 92.5% |
| Interquartile Range (IQR) | 4.5% | 4.3% |
| Standard Deviation (Sample) | 5.3% | 4.6% |
| Standard Deviation (Population) | 5.2% | 4.6% |
Demographics Similar to Shoshone and Somalis by 12th Grade, No Diploma
In terms of 12th grade, no diploma, the demographic groups most similar to Shoshone are Cherokee (90.5%, a difference of 0.0%), Immigrants from Cameroon (90.5%, a difference of 0.0%), Arapaho (90.5%, a difference of 0.010%), Uruguayan (90.4%, a difference of 0.020%), and Immigrants from Africa (90.5%, a difference of 0.040%). Similarly, the demographic groups most similar to Somalis are Portuguese (90.6%, a difference of 0.010%), Immigrants from Afghanistan (90.6%, a difference of 0.020%), South American Indian (90.6%, a difference of 0.020%), Immigrants from Micronesia (90.6%, a difference of 0.030%), and Costa Rican (90.5%, a difference of 0.030%).
| Demographics | Rating | Rank | 12th Grade, No Diploma |
| French American Indians | 15.5 /100 | #204 | Poor 90.7% |
| Immigrants | Sierra Leone | 14.9 /100 | #205 | Poor 90.7% |
| Immigrants | Bolivia | 12.3 /100 | #206 | Poor 90.6% |
| Armenians | 11.6 /100 | #207 | Poor 90.6% |
| Immigrants | Micronesia | 11.0 /100 | #208 | Poor 90.6% |
| Immigrants | Afghanistan | 11.0 /100 | #209 | Poor 90.6% |
| South American Indians | 10.9 /100 | #210 | Poor 90.6% |
| Portuguese | 10.6 /100 | #211 | Poor 90.6% |
| Somalis | 10.2 /100 | #212 | Poor 90.6% |
| Costa Ricans | 9.4 /100 | #213 | Tragic 90.5% |
| Immigrants | Africa | 8.5 /100 | #214 | Tragic 90.5% |
| Arapaho | 7.7 /100 | #215 | Tragic 90.5% |
| Shoshone | 7.5 /100 | #216 | Tragic 90.5% |
| Cherokee | 7.4 /100 | #217 | Tragic 90.5% |
| Immigrants | Cameroon | 7.4 /100 | #218 | Tragic 90.5% |
| Uruguayans | 7.0 /100 | #219 | Tragic 90.4% |
| Colombians | 6.6 /100 | #220 | Tragic 90.4% |
| Immigrants | Liberia | 5.7 /100 | #221 | Tragic 90.4% |
| Immigrants | Somalia | 5.3 /100 | #222 | Tragic 90.4% |
| South Americans | 5.0 /100 | #223 | Tragic 90.3% |
| Immigrants | Panama | 4.8 /100 | #224 | Tragic 90.3% |