Shoshone vs Cypriot Male Disability
COMPARE
Shoshone
Cypriot
Male Disability
Male Disability Comparison
Shoshone
Cypriots
13.8%
MALE DISABILITY
0.0/ 100
METRIC RATING
321st/ 347
METRIC RANK
10.0%
MALE DISABILITY
100.0/ 100
METRIC RATING
23rd/ 347
METRIC RANK
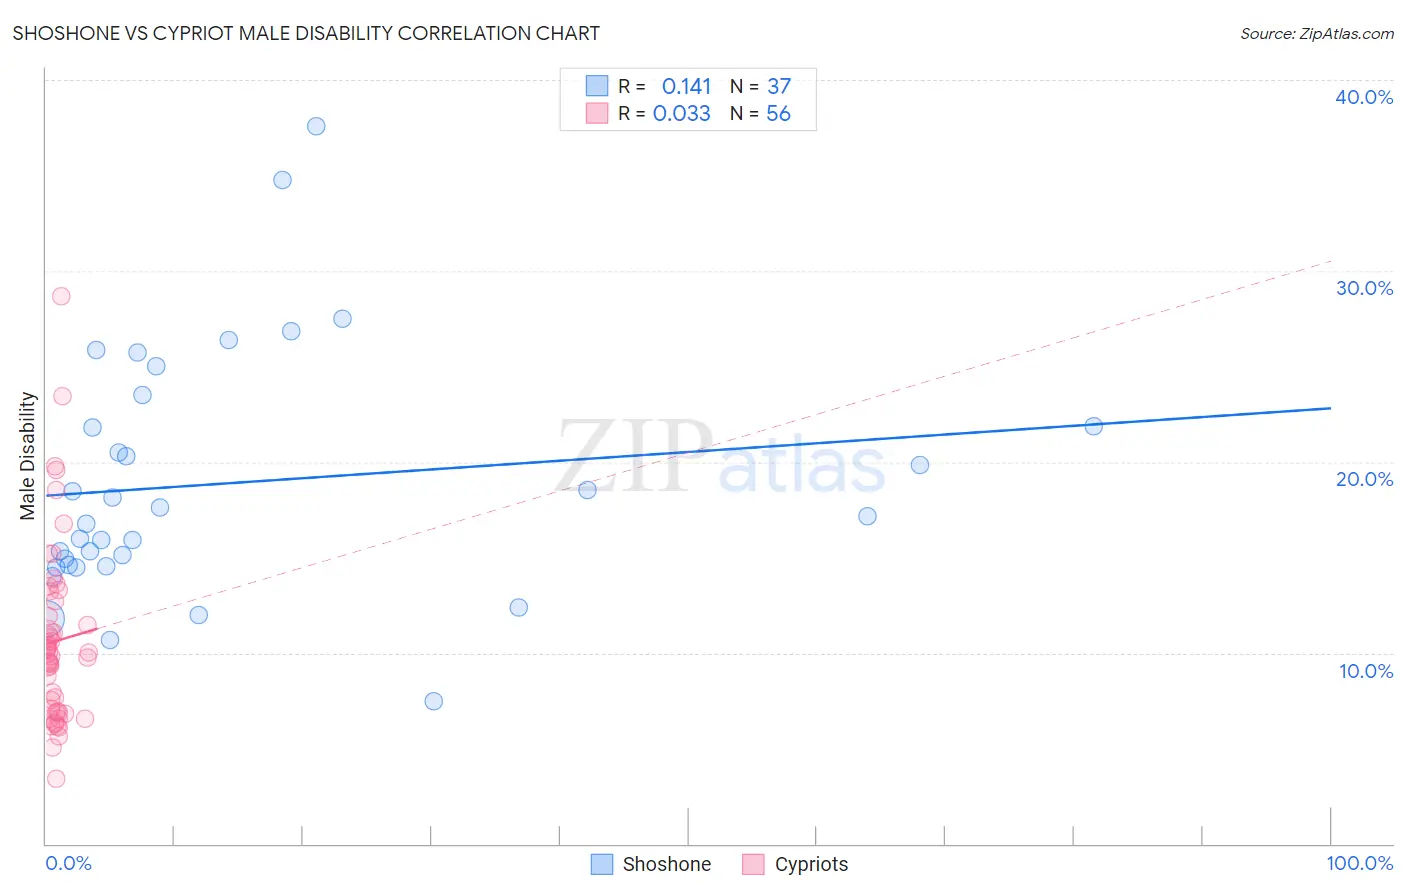
Shoshone vs Cypriot Male Disability Correlation Chart
The statistical analysis conducted on geographies consisting of 66,619,814 people shows a poor positive correlation between the proportion of Shoshone and percentage of males with a disability in the United States with a correlation coefficient (R) of 0.141 and weighted average of 13.8%. Similarly, the statistical analysis conducted on geographies consisting of 61,868,977 people shows no correlation between the proportion of Cypriots and percentage of males with a disability in the United States with a correlation coefficient (R) of 0.033 and weighted average of 10.0%, a difference of 38.3%.
Male Disability Correlation Summary
| Measurement | Shoshone | Cypriot |
| Minimum | 7.4% | 3.4% |
| Maximum | 37.6% | 28.7% |
| Range | 30.1% | 25.3% |
| Mean | 18.9% | 10.6% |
| Median | 17.1% | 9.9% |
| Interquartile 25% (IQ1) | 14.6% | 6.9% |
| Interquartile 75% (IQ3) | 22.7% | 12.3% |
| Interquartile Range (IQR) | 8.1% | 5.4% |
| Standard Deviation (Sample) | 6.5% | 4.7% |
| Standard Deviation (Population) | 6.4% | 4.6% |
Similar Demographics by Male Disability
Demographics Similar to Shoshone by Male Disability
In terms of male disability, the demographic groups most similar to Shoshone are Tlingit-Haida (13.8%, a difference of 0.050%), American (13.8%, a difference of 0.54%), Cree (13.7%, a difference of 0.96%), Apache (14.0%, a difference of 1.1%), and Paiute (13.7%, a difference of 1.2%).
| Demographics | Rating | Rank | Male Disability |
| Aleuts | 0.0 /100 | #314 | Tragic 13.5% |
| Iroquois | 0.0 /100 | #315 | Tragic 13.6% |
| Alaska Natives | 0.0 /100 | #316 | Tragic 13.6% |
| Paiute | 0.0 /100 | #317 | Tragic 13.7% |
| Cree | 0.0 /100 | #318 | Tragic 13.7% |
| Americans | 0.0 /100 | #319 | Tragic 13.8% |
| Tlingit-Haida | 0.0 /100 | #320 | Tragic 13.8% |
| Shoshone | 0.0 /100 | #321 | Tragic 13.8% |
| Apache | 0.0 /100 | #322 | Tragic 14.0% |
| Osage | 0.0 /100 | #323 | Tragic 14.0% |
| Comanche | 0.0 /100 | #324 | Tragic 14.1% |
| Ottawa | 0.0 /100 | #325 | Tragic 14.1% |
| Natives/Alaskans | 0.0 /100 | #326 | Tragic 14.2% |
| Potawatomi | 0.0 /100 | #327 | Tragic 14.2% |
| Chippewa | 0.0 /100 | #328 | Tragic 14.3% |
Demographics Similar to Cypriots by Male Disability
In terms of male disability, the demographic groups most similar to Cypriots are Immigrants from Venezuela (10.0%, a difference of 0.090%), Immigrants from Asia (10.0%, a difference of 0.14%), Immigrants from Malaysia (10.0%, a difference of 0.32%), Burmese (10.0%, a difference of 0.38%), and Paraguayan (10.1%, a difference of 0.45%).
| Demographics | Rating | Rank | Male Disability |
| Okinawans | 100.0 /100 | #16 | Exceptional 9.8% |
| Immigrants | Korea | 100.0 /100 | #17 | Exceptional 9.8% |
| Immigrants | Pakistan | 100.0 /100 | #18 | Exceptional 9.8% |
| Immigrants | Sri Lanka | 100.0 /100 | #19 | Exceptional 10.0% |
| Asians | 100.0 /100 | #20 | Exceptional 10.0% |
| Burmese | 100.0 /100 | #21 | Exceptional 10.0% |
| Immigrants | Venezuela | 100.0 /100 | #22 | Exceptional 10.0% |
| Cypriots | 100.0 /100 | #23 | Exceptional 10.0% |
| Immigrants | Asia | 100.0 /100 | #24 | Exceptional 10.0% |
| Immigrants | Malaysia | 99.9 /100 | #25 | Exceptional 10.0% |
| Paraguayans | 99.9 /100 | #26 | Exceptional 10.1% |
| Egyptians | 99.9 /100 | #27 | Exceptional 10.1% |
| Vietnamese | 99.9 /100 | #28 | Exceptional 10.1% |
| Venezuelans | 99.9 /100 | #29 | Exceptional 10.1% |
| Immigrants | Egypt | 99.9 /100 | #30 | Exceptional 10.1% |