Shoshone vs Lebanese Disability Age Under 5
COMPARE
Shoshone
Lebanese
Disability Age Under 5
Disability Age Under 5 Comparison
Shoshone
Lebanese
1.6%
DISABILITY AGE UNDER 5
0.0/ 100
METRIC RATING
300th/ 347
METRIC RANK
1.3%
DISABILITY AGE UNDER 5
5.3/ 100
METRIC RATING
230th/ 347
METRIC RANK
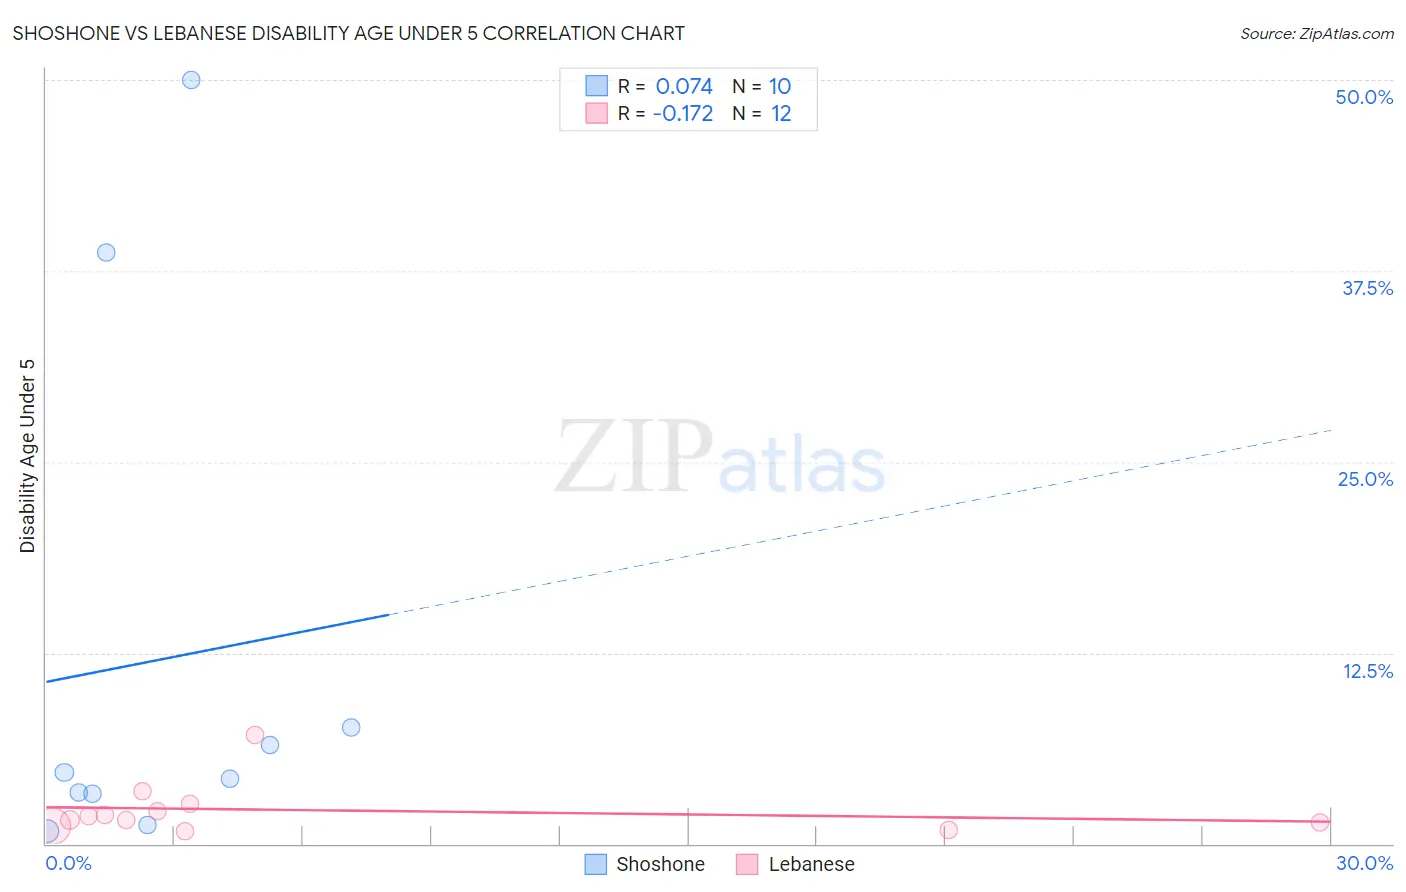
Shoshone vs Lebanese Disability Age Under 5 Correlation Chart
The statistical analysis conducted on geographies consisting of 55,591,533 people shows a slight positive correlation between the proportion of Shoshone and percentage of population with a disability under the age of 5 in the United States with a correlation coefficient (R) of 0.074 and weighted average of 1.6%. Similarly, the statistical analysis conducted on geographies consisting of 215,601,141 people shows a poor negative correlation between the proportion of Lebanese and percentage of population with a disability under the age of 5 in the United States with a correlation coefficient (R) of -0.172 and weighted average of 1.3%, a difference of 22.7%.
Disability Age Under 5 Correlation Summary
| Measurement | Shoshone | Lebanese |
| Minimum | 0.81% | 0.84% |
| Maximum | 50.0% | 7.1% |
| Range | 49.2% | 6.3% |
| Mean | 12.0% | 2.2% |
| Median | 4.5% | 1.7% |
| Interquartile 25% (IQ1) | 3.3% | 1.3% |
| Interquartile 75% (IQ3) | 7.6% | 2.4% |
| Interquartile Range (IQR) | 4.3% | 1.1% |
| Standard Deviation (Sample) | 17.4% | 1.7% |
| Standard Deviation (Population) | 16.5% | 1.6% |
Similar Demographics by Disability Age Under 5
Demographics Similar to Shoshone by Disability Age Under 5
In terms of disability age under 5, the demographic groups most similar to Shoshone are Portuguese (1.6%, a difference of 0.33%), German Russian (1.6%, a difference of 0.44%), Welsh (1.6%, a difference of 0.56%), Swiss (1.6%, a difference of 0.72%), and Nonimmigrants (1.6%, a difference of 0.91%).
| Demographics | Rating | Rank | Disability Age Under 5 |
| Lithuanians | 0.0 /100 | #293 | Tragic 1.6% |
| Swedes | 0.0 /100 | #294 | Tragic 1.6% |
| Finns | 0.0 /100 | #295 | Tragic 1.6% |
| Poles | 0.0 /100 | #296 | Tragic 1.6% |
| Immigrants | Nonimmigrants | 0.0 /100 | #297 | Tragic 1.6% |
| Cajuns | 0.0 /100 | #298 | Tragic 1.6% |
| Portuguese | 0.0 /100 | #299 | Tragic 1.6% |
| Shoshone | 0.0 /100 | #300 | Tragic 1.6% |
| German Russians | 0.0 /100 | #301 | Tragic 1.6% |
| Welsh | 0.0 /100 | #302 | Tragic 1.6% |
| Swiss | 0.0 /100 | #303 | Tragic 1.6% |
| Seminole | 0.0 /100 | #304 | Tragic 1.6% |
| Blackfeet | 0.0 /100 | #305 | Tragic 1.6% |
| Creek | 0.0 /100 | #306 | Tragic 1.6% |
| Scottish | 0.0 /100 | #307 | Tragic 1.6% |
Demographics Similar to Lebanese by Disability Age Under 5
In terms of disability age under 5, the demographic groups most similar to Lebanese are Immigrants from Costa Rica (1.3%, a difference of 0.10%), Immigrants from Northern Europe (1.3%, a difference of 0.25%), Luxembourger (1.3%, a difference of 0.31%), Taiwanese (1.3%, a difference of 0.32%), and French American Indian (1.3%, a difference of 0.38%).
| Demographics | Rating | Rank | Disability Age Under 5 |
| Hispanics or Latinos | 7.7 /100 | #223 | Tragic 1.3% |
| Latvians | 7.1 /100 | #224 | Tragic 1.3% |
| Panamanians | 7.1 /100 | #225 | Tragic 1.3% |
| Bahamians | 7.1 /100 | #226 | Tragic 1.3% |
| Taiwanese | 6.1 /100 | #227 | Tragic 1.3% |
| Luxembourgers | 6.1 /100 | #228 | Tragic 1.3% |
| Immigrants | Costa Rica | 5.5 /100 | #229 | Tragic 1.3% |
| Lebanese | 5.3 /100 | #230 | Tragic 1.3% |
| Immigrants | Northern Europe | 4.7 /100 | #231 | Tragic 1.3% |
| French American Indians | 4.5 /100 | #232 | Tragic 1.3% |
| Tongans | 4.2 /100 | #233 | Tragic 1.3% |
| Pueblo | 3.8 /100 | #234 | Tragic 1.3% |
| Central American Indians | 3.6 /100 | #235 | Tragic 1.3% |
| South American Indians | 3.3 /100 | #236 | Tragic 1.3% |
| Basques | 3.0 /100 | #237 | Tragic 1.3% |