British West Indian vs Jordanian Ambulatory Disability
COMPARE
British West Indian
Jordanian
Ambulatory Disability
Ambulatory Disability Comparison
British West Indians
Jordanians
7.0%
AMBULATORY DISABILITY
0.0/ 100
METRIC RATING
301st/ 347
METRIC RANK
5.6%
AMBULATORY DISABILITY
99.8/ 100
METRIC RATING
52nd/ 347
METRIC RANK
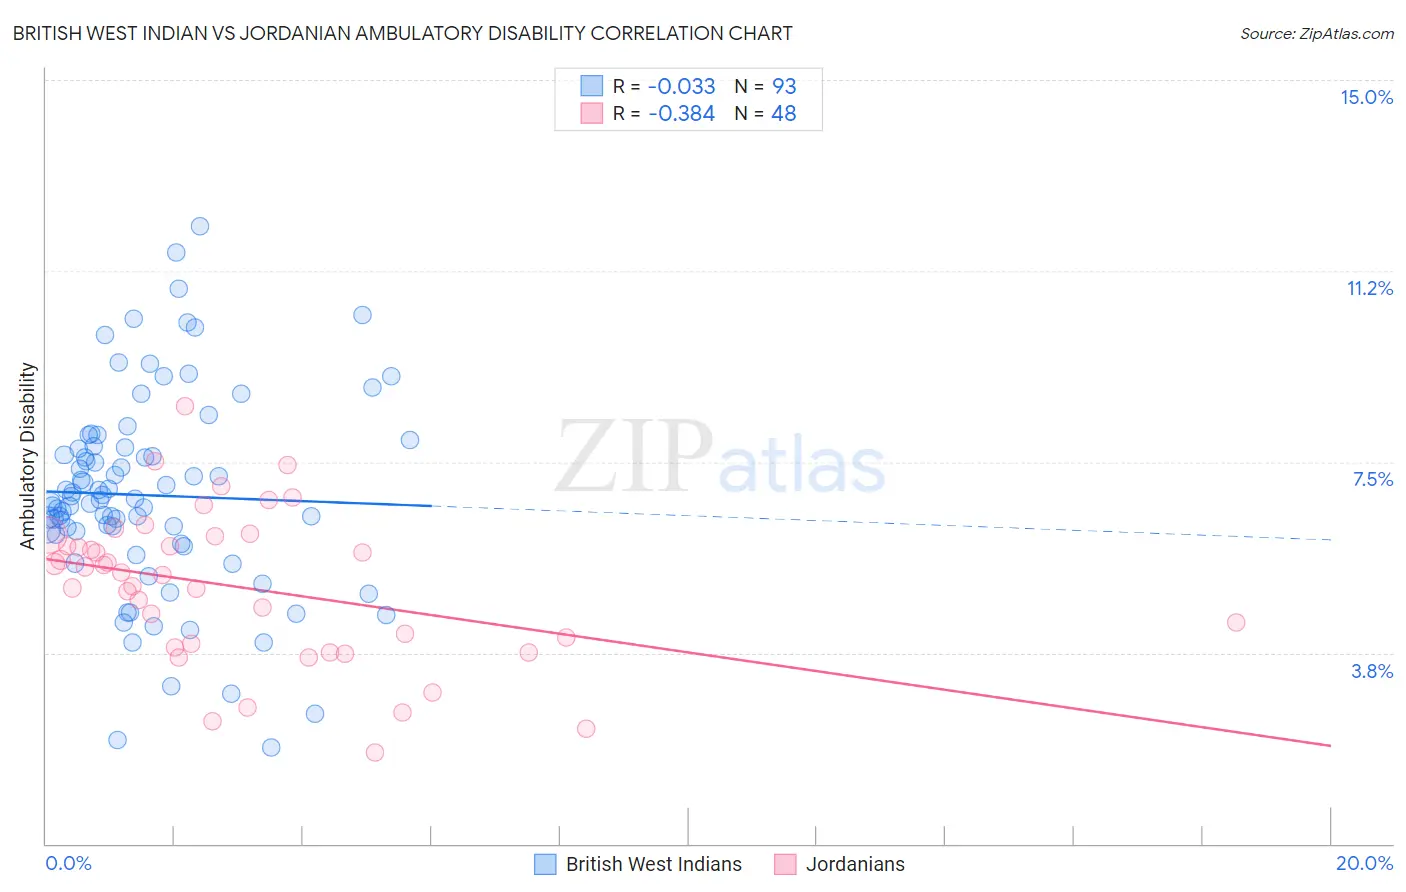
British West Indian vs Jordanian Ambulatory Disability Correlation Chart
The statistical analysis conducted on geographies consisting of 152,684,150 people shows no correlation between the proportion of British West Indians and percentage of population with ambulatory disability in the United States with a correlation coefficient (R) of -0.033 and weighted average of 7.0%. Similarly, the statistical analysis conducted on geographies consisting of 166,412,494 people shows a mild negative correlation between the proportion of Jordanians and percentage of population with ambulatory disability in the United States with a correlation coefficient (R) of -0.384 and weighted average of 5.6%, a difference of 24.4%.
Ambulatory Disability Correlation Summary
| Measurement | British West Indian | Jordanian |
| Minimum | 1.9% | 1.8% |
| Maximum | 12.1% | 8.6% |
| Range | 10.2% | 6.8% |
| Mean | 6.8% | 5.0% |
| Median | 6.8% | 5.3% |
| Interquartile 25% (IQ1) | 6.0% | 3.9% |
| Interquartile 75% (IQ3) | 7.8% | 5.9% |
| Interquartile Range (IQR) | 1.8% | 2.1% |
| Standard Deviation (Sample) | 2.0% | 1.5% |
| Standard Deviation (Population) | 2.0% | 1.5% |
Similar Demographics by Ambulatory Disability
Demographics Similar to British West Indians by Ambulatory Disability
In terms of ambulatory disability, the demographic groups most similar to British West Indians are Immigrants from Armenia (7.0%, a difference of 0.060%), African (7.0%, a difference of 0.11%), Marshallese (6.9%, a difference of 0.23%), Puget Sound Salish (6.9%, a difference of 0.24%), and Immigrants from Grenada (6.9%, a difference of 0.37%).
| Demographics | Rating | Rank | Ambulatory Disability |
| Cape Verdeans | 0.0 /100 | #294 | Tragic 6.9% |
| Crow | 0.0 /100 | #295 | Tragic 6.9% |
| Alaskan Athabascans | 0.0 /100 | #296 | Tragic 6.9% |
| French American Indians | 0.0 /100 | #297 | Tragic 6.9% |
| Immigrants | Grenada | 0.0 /100 | #298 | Tragic 6.9% |
| Puget Sound Salish | 0.0 /100 | #299 | Tragic 6.9% |
| Marshallese | 0.0 /100 | #300 | Tragic 6.9% |
| British West Indians | 0.0 /100 | #301 | Tragic 7.0% |
| Immigrants | Armenia | 0.0 /100 | #302 | Tragic 7.0% |
| Africans | 0.0 /100 | #303 | Tragic 7.0% |
| Immigrants | Cabo Verde | 0.0 /100 | #304 | Tragic 7.0% |
| Immigrants | Micronesia | 0.0 /100 | #305 | Tragic 7.0% |
| Iroquois | 0.0 /100 | #306 | Tragic 7.1% |
| Spanish Americans | 0.0 /100 | #307 | Tragic 7.1% |
| Chippewa | 0.0 /100 | #308 | Tragic 7.1% |
Demographics Similar to Jordanians by Ambulatory Disability
In terms of ambulatory disability, the demographic groups most similar to Jordanians are Immigrants from Egypt (5.6%, a difference of 0.010%), Immigrants from Eastern Africa (5.6%, a difference of 0.060%), Taiwanese (5.6%, a difference of 0.090%), Immigrants from Bulgaria (5.6%, a difference of 0.12%), and Luxembourger (5.6%, a difference of 0.19%).
| Demographics | Rating | Rank | Ambulatory Disability |
| Immigrants | Sweden | 99.9 /100 | #45 | Exceptional 5.6% |
| Egyptians | 99.9 /100 | #46 | Exceptional 5.6% |
| Immigrants | Japan | 99.9 /100 | #47 | Exceptional 5.6% |
| Immigrants | Argentina | 99.9 /100 | #48 | Exceptional 5.6% |
| Bulgarians | 99.9 /100 | #49 | Exceptional 5.6% |
| Luxembourgers | 99.9 /100 | #50 | Exceptional 5.6% |
| Taiwanese | 99.8 /100 | #51 | Exceptional 5.6% |
| Jordanians | 99.8 /100 | #52 | Exceptional 5.6% |
| Immigrants | Egypt | 99.8 /100 | #53 | Exceptional 5.6% |
| Immigrants | Eastern Africa | 99.8 /100 | #54 | Exceptional 5.6% |
| Immigrants | Bulgaria | 99.8 /100 | #55 | Exceptional 5.6% |
| Inupiat | 99.8 /100 | #56 | Exceptional 5.6% |
| Immigrants | Brazil | 99.8 /100 | #57 | Exceptional 5.6% |
| Immigrants | Zimbabwe | 99.8 /100 | #58 | Exceptional 5.6% |
| Immigrants | Afghanistan | 99.8 /100 | #59 | Exceptional 5.6% |