Immigrants from Southern Europe vs Jordanian Ambulatory Disability
COMPARE
Immigrants from Southern Europe
Jordanian
Ambulatory Disability
Ambulatory Disability Comparison
Immigrants from Southern Europe
Jordanians
6.1%
AMBULATORY DISABILITY
58.1/ 100
METRIC RATING
169th/ 347
METRIC RANK
5.6%
AMBULATORY DISABILITY
99.8/ 100
METRIC RATING
52nd/ 347
METRIC RANK
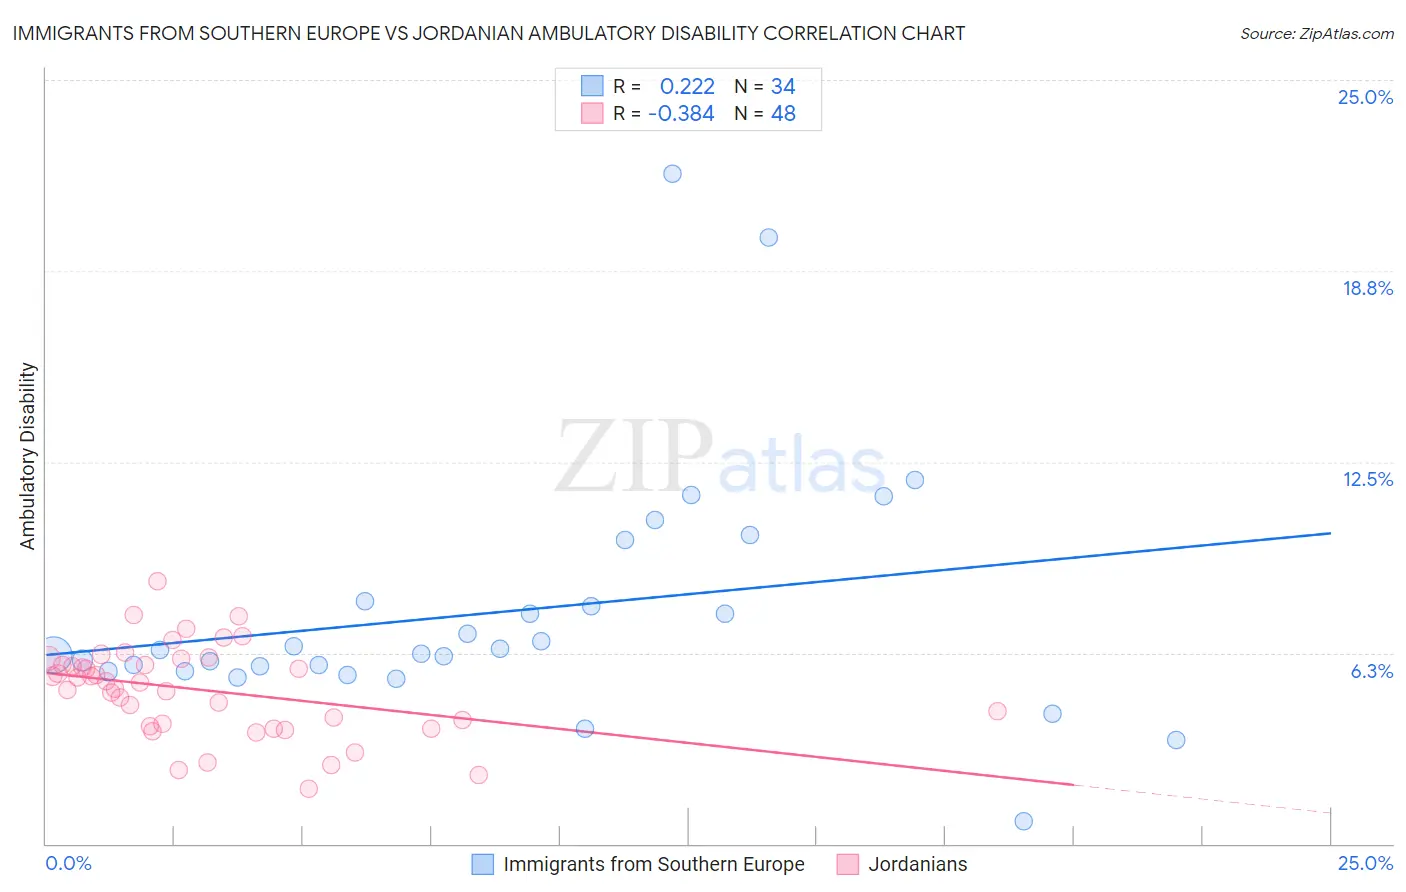
Immigrants from Southern Europe vs Jordanian Ambulatory Disability Correlation Chart
The statistical analysis conducted on geographies consisting of 402,703,105 people shows a weak positive correlation between the proportion of Immigrants from Southern Europe and percentage of population with ambulatory disability in the United States with a correlation coefficient (R) of 0.222 and weighted average of 6.1%. Similarly, the statistical analysis conducted on geographies consisting of 166,412,494 people shows a mild negative correlation between the proportion of Jordanians and percentage of population with ambulatory disability in the United States with a correlation coefficient (R) of -0.384 and weighted average of 5.6%, a difference of 8.8%.
Ambulatory Disability Correlation Summary
| Measurement | Immigrants from Southern Europe | Jordanian |
| Minimum | 0.74% | 1.8% |
| Maximum | 22.0% | 8.6% |
| Range | 21.2% | 6.8% |
| Mean | 7.6% | 5.0% |
| Median | 6.3% | 5.3% |
| Interquartile 25% (IQ1) | 5.7% | 3.9% |
| Interquartile 75% (IQ3) | 7.9% | 5.9% |
| Interquartile Range (IQR) | 2.3% | 2.1% |
| Standard Deviation (Sample) | 4.1% | 1.5% |
| Standard Deviation (Population) | 4.1% | 1.5% |
Similar Demographics by Ambulatory Disability
Demographics Similar to Immigrants from Southern Europe by Ambulatory Disability
In terms of ambulatory disability, the demographic groups most similar to Immigrants from Southern Europe are Ecuadorian (6.1%, a difference of 0.14%), Immigrants from Oceania (6.1%, a difference of 0.15%), Immigrants from Ecuador (6.1%, a difference of 0.23%), Iraqi (6.1%, a difference of 0.26%), and Nicaraguan (6.1%, a difference of 0.29%).
| Demographics | Rating | Rank | Ambulatory Disability |
| Nigerians | 67.1 /100 | #162 | Good 6.1% |
| Lebanese | 66.2 /100 | #163 | Good 6.1% |
| Basques | 63.7 /100 | #164 | Good 6.1% |
| Nicaraguans | 63.2 /100 | #165 | Good 6.1% |
| Iraqis | 62.8 /100 | #166 | Good 6.1% |
| Immigrants | Oceania | 60.7 /100 | #167 | Good 6.1% |
| Ecuadorians | 60.5 /100 | #168 | Good 6.1% |
| Immigrants | Southern Europe | 58.1 /100 | #169 | Average 6.1% |
| Immigrants | Ecuador | 53.8 /100 | #170 | Average 6.1% |
| Moroccans | 52.6 /100 | #171 | Average 6.1% |
| Immigrants | Burma/Myanmar | 52.2 /100 | #172 | Average 6.1% |
| Croatians | 51.2 /100 | #173 | Average 6.1% |
| Immigrants | Canada | 50.0 /100 | #174 | Average 6.1% |
| Vietnamese | 47.2 /100 | #175 | Average 6.1% |
| Immigrants | North America | 45.6 /100 | #176 | Average 6.1% |
Demographics Similar to Jordanians by Ambulatory Disability
In terms of ambulatory disability, the demographic groups most similar to Jordanians are Immigrants from Egypt (5.6%, a difference of 0.010%), Immigrants from Eastern Africa (5.6%, a difference of 0.060%), Taiwanese (5.6%, a difference of 0.090%), Immigrants from Bulgaria (5.6%, a difference of 0.12%), and Luxembourger (5.6%, a difference of 0.19%).
| Demographics | Rating | Rank | Ambulatory Disability |
| Immigrants | Sweden | 99.9 /100 | #45 | Exceptional 5.6% |
| Egyptians | 99.9 /100 | #46 | Exceptional 5.6% |
| Immigrants | Japan | 99.9 /100 | #47 | Exceptional 5.6% |
| Immigrants | Argentina | 99.9 /100 | #48 | Exceptional 5.6% |
| Bulgarians | 99.9 /100 | #49 | Exceptional 5.6% |
| Luxembourgers | 99.9 /100 | #50 | Exceptional 5.6% |
| Taiwanese | 99.8 /100 | #51 | Exceptional 5.6% |
| Jordanians | 99.8 /100 | #52 | Exceptional 5.6% |
| Immigrants | Egypt | 99.8 /100 | #53 | Exceptional 5.6% |
| Immigrants | Eastern Africa | 99.8 /100 | #54 | Exceptional 5.6% |
| Immigrants | Bulgaria | 99.8 /100 | #55 | Exceptional 5.6% |
| Inupiat | 99.8 /100 | #56 | Exceptional 5.6% |
| Immigrants | Brazil | 99.8 /100 | #57 | Exceptional 5.6% |
| Immigrants | Zimbabwe | 99.8 /100 | #58 | Exceptional 5.6% |
| Immigrants | Afghanistan | 99.8 /100 | #59 | Exceptional 5.6% |