Jordanian vs Indonesian Ambulatory Disability
COMPARE
Jordanian
Indonesian
Ambulatory Disability
Ambulatory Disability Comparison
Jordanians
Indonesians
5.6%
AMBULATORY DISABILITY
99.8/ 100
METRIC RATING
52nd/ 347
METRIC RANK
6.3%
AMBULATORY DISABILITY
9.9/ 100
METRIC RATING
219th/ 347
METRIC RANK
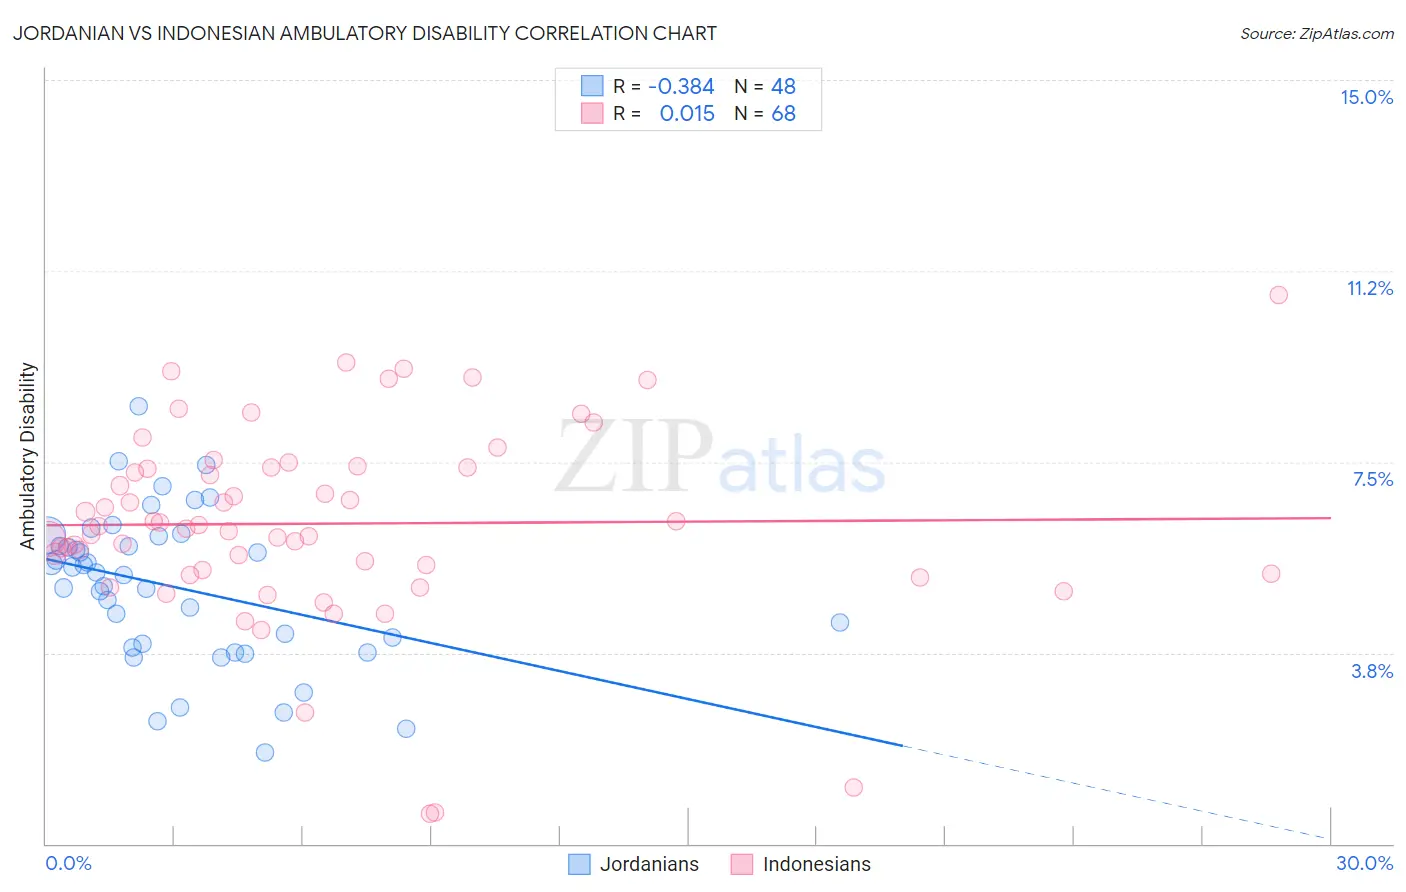
Jordanian vs Indonesian Ambulatory Disability Correlation Chart
The statistical analysis conducted on geographies consisting of 166,412,494 people shows a mild negative correlation between the proportion of Jordanians and percentage of population with ambulatory disability in the United States with a correlation coefficient (R) of -0.384 and weighted average of 5.6%. Similarly, the statistical analysis conducted on geographies consisting of 162,682,177 people shows no correlation between the proportion of Indonesians and percentage of population with ambulatory disability in the United States with a correlation coefficient (R) of 0.015 and weighted average of 6.3%, a difference of 12.5%.
Ambulatory Disability Correlation Summary
| Measurement | Jordanian | Indonesian |
| Minimum | 1.8% | 0.59% |
| Maximum | 8.6% | 10.8% |
| Range | 6.8% | 10.2% |
| Mean | 5.0% | 6.3% |
| Median | 5.3% | 6.2% |
| Interquartile 25% (IQ1) | 3.9% | 5.3% |
| Interquartile 75% (IQ3) | 5.9% | 7.4% |
| Interquartile Range (IQR) | 2.1% | 2.1% |
| Standard Deviation (Sample) | 1.5% | 1.9% |
| Standard Deviation (Population) | 1.5% | 1.9% |
Similar Demographics by Ambulatory Disability
Demographics Similar to Jordanians by Ambulatory Disability
In terms of ambulatory disability, the demographic groups most similar to Jordanians are Immigrants from Egypt (5.6%, a difference of 0.010%), Immigrants from Eastern Africa (5.6%, a difference of 0.060%), Taiwanese (5.6%, a difference of 0.090%), Immigrants from Bulgaria (5.6%, a difference of 0.12%), and Luxembourger (5.6%, a difference of 0.19%).
| Demographics | Rating | Rank | Ambulatory Disability |
| Immigrants | Sweden | 99.9 /100 | #45 | Exceptional 5.6% |
| Egyptians | 99.9 /100 | #46 | Exceptional 5.6% |
| Immigrants | Japan | 99.9 /100 | #47 | Exceptional 5.6% |
| Immigrants | Argentina | 99.9 /100 | #48 | Exceptional 5.6% |
| Bulgarians | 99.9 /100 | #49 | Exceptional 5.6% |
| Luxembourgers | 99.9 /100 | #50 | Exceptional 5.6% |
| Taiwanese | 99.8 /100 | #51 | Exceptional 5.6% |
| Jordanians | 99.8 /100 | #52 | Exceptional 5.6% |
| Immigrants | Egypt | 99.8 /100 | #53 | Exceptional 5.6% |
| Immigrants | Eastern Africa | 99.8 /100 | #54 | Exceptional 5.6% |
| Immigrants | Bulgaria | 99.8 /100 | #55 | Exceptional 5.6% |
| Inupiat | 99.8 /100 | #56 | Exceptional 5.6% |
| Immigrants | Brazil | 99.8 /100 | #57 | Exceptional 5.6% |
| Immigrants | Zimbabwe | 99.8 /100 | #58 | Exceptional 5.6% |
| Immigrants | Afghanistan | 99.8 /100 | #59 | Exceptional 5.6% |
Demographics Similar to Indonesians by Ambulatory Disability
In terms of ambulatory disability, the demographic groups most similar to Indonesians are Immigrants from Albania (6.3%, a difference of 0.040%), Hungarian (6.3%, a difference of 0.050%), German Russian (6.3%, a difference of 0.070%), Guamanian/Chamorro (6.3%, a difference of 0.10%), and Canadian (6.3%, a difference of 0.14%).
| Demographics | Rating | Rank | Ambulatory Disability |
| Mexican American Indians | 12.0 /100 | #212 | Poor 6.3% |
| Japanese | 12.0 /100 | #213 | Poor 6.3% |
| Immigrants | Mexico | 11.0 /100 | #214 | Poor 6.3% |
| Immigrants | Latin America | 11.0 /100 | #215 | Poor 6.3% |
| Canadians | 10.9 /100 | #216 | Poor 6.3% |
| Yugoslavians | 10.9 /100 | #217 | Poor 6.3% |
| Guamanians/Chamorros | 10.6 /100 | #218 | Poor 6.3% |
| Indonesians | 9.9 /100 | #219 | Tragic 6.3% |
| Immigrants | Albania | 9.6 /100 | #220 | Tragic 6.3% |
| Hungarians | 9.6 /100 | #221 | Tragic 6.3% |
| German Russians | 9.4 /100 | #222 | Tragic 6.3% |
| Immigrants | Honduras | 7.6 /100 | #223 | Tragic 6.3% |
| Liberians | 7.1 /100 | #224 | Tragic 6.3% |
| Hondurans | 6.3 /100 | #225 | Tragic 6.3% |
| Slavs | 5.1 /100 | #226 | Tragic 6.4% |