Shoshone vs Immigrants from Scotland Unemployment Among Women with Children Ages 6 to 17 years
COMPARE
Shoshone
Immigrants from Scotland
Unemployment Among Women with Children Ages 6 to 17 years
Unemployment Among Women with Children Ages 6 to 17 years Comparison
Shoshone
Immigrants from Scotland
10.0%
UNEMPLOYMENT AMONG WOMEN WITH CHILDREN AGES 6 TO 17 YEARS
0.0/ 100
METRIC RATING
288th/ 347
METRIC RANK
9.2%
UNEMPLOYMENT AMONG WOMEN WITH CHILDREN AGES 6 TO 17 YEARS
6.6/ 100
METRIC RATING
219th/ 347
METRIC RANK
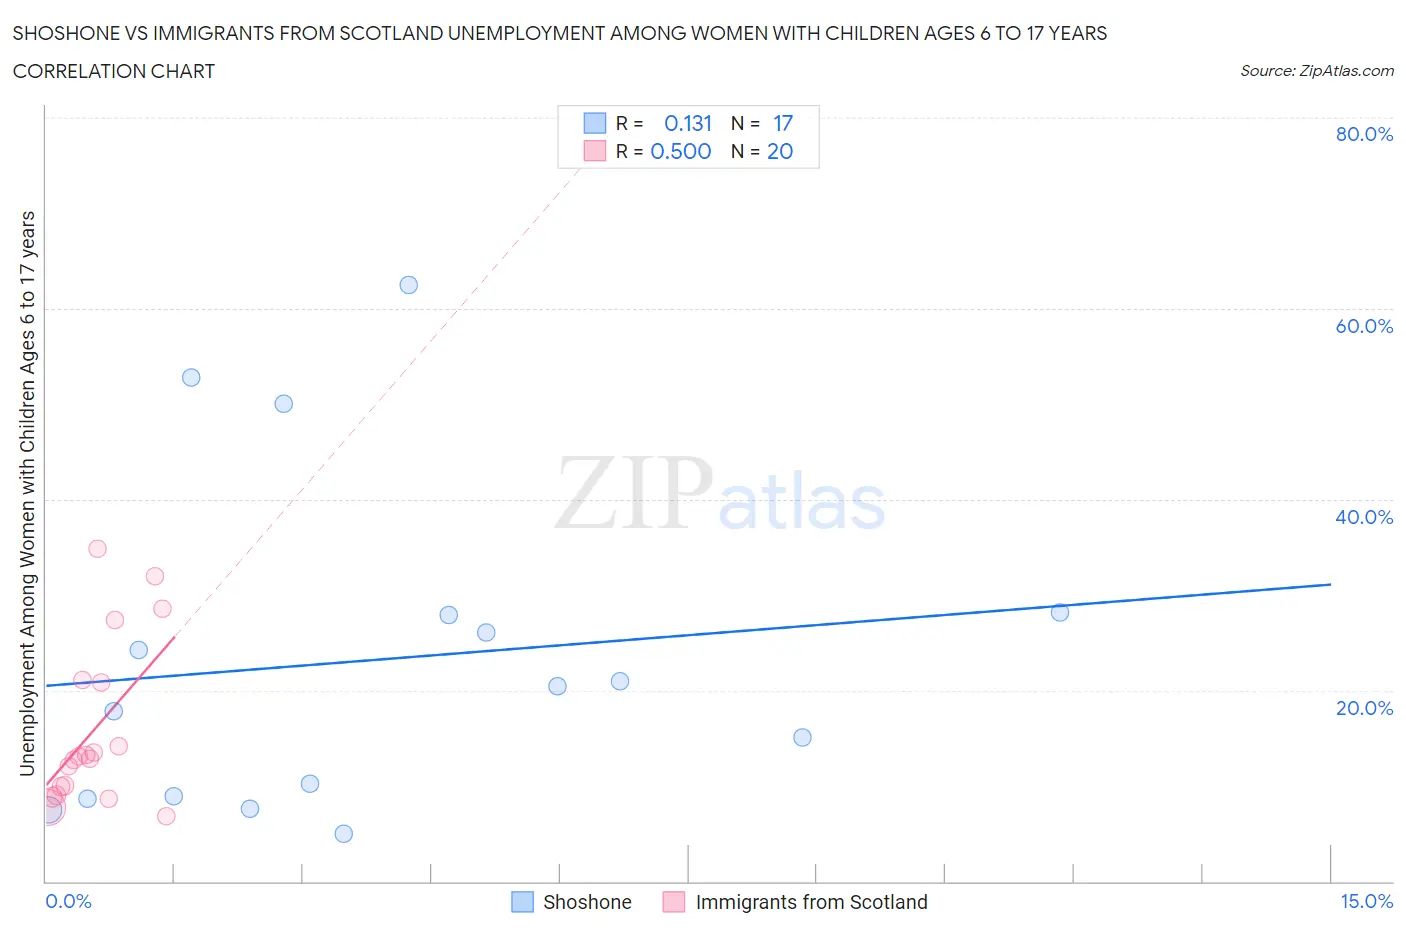
Shoshone vs Immigrants from Scotland Unemployment Among Women with Children Ages 6 to 17 years Correlation Chart
The statistical analysis conducted on geographies consisting of 59,556,490 people shows a poor positive correlation between the proportion of Shoshone and unemployment rate among women with children between the ages 6 and 17 in the United States with a correlation coefficient (R) of 0.131 and weighted average of 10.0%. Similarly, the statistical analysis conducted on geographies consisting of 154,369,144 people shows a moderate positive correlation between the proportion of Immigrants from Scotland and unemployment rate among women with children between the ages 6 and 17 in the United States with a correlation coefficient (R) of 0.500 and weighted average of 9.2%, a difference of 7.9%.
Unemployment Among Women with Children Ages 6 to 17 years Correlation Summary
| Measurement | Shoshone | Immigrants from Scotland |
| Minimum | 5.0% | 6.8% |
| Maximum | 62.5% | 34.9% |
| Range | 57.5% | 28.1% |
| Mean | 23.2% | 15.9% |
| Median | 20.4% | 13.0% |
| Interquartile 25% (IQ1) | 8.8% | 9.4% |
| Interquartile 75% (IQ3) | 28.1% | 20.9% |
| Interquartile Range (IQR) | 19.2% | 11.5% |
| Standard Deviation (Sample) | 17.2% | 8.6% |
| Standard Deviation (Population) | 16.6% | 8.3% |
Similar Demographics by Unemployment Among Women with Children Ages 6 to 17 years
Demographics Similar to Shoshone by Unemployment Among Women with Children Ages 6 to 17 years
In terms of unemployment among women with children ages 6 to 17 years, the demographic groups most similar to Shoshone are Sierra Leonean (9.9%, a difference of 0.24%), Choctaw (9.9%, a difference of 0.29%), Hispanic or Latino (9.9%, a difference of 0.41%), Honduran (10.0%, a difference of 0.43%), and Subsaharan African (10.0%, a difference of 0.44%).
| Demographics | Rating | Rank | Unemployment Among Women with Children Ages 6 to 17 years |
| Jamaicans | 0.0 /100 | #281 | Tragic 9.8% |
| Slovaks | 0.0 /100 | #282 | Tragic 9.8% |
| Central American Indians | 0.0 /100 | #283 | Tragic 9.9% |
| Yakama | 0.0 /100 | #284 | Tragic 9.9% |
| Hispanics or Latinos | 0.0 /100 | #285 | Tragic 9.9% |
| Choctaw | 0.0 /100 | #286 | Tragic 9.9% |
| Sierra Leoneans | 0.0 /100 | #287 | Tragic 9.9% |
| Shoshone | 0.0 /100 | #288 | Tragic 10.0% |
| Hondurans | 0.0 /100 | #289 | Tragic 10.0% |
| Sub-Saharan Africans | 0.0 /100 | #290 | Tragic 10.0% |
| Immigrants | Nonimmigrants | 0.0 /100 | #291 | Tragic 10.0% |
| Carpatho Rusyns | 0.0 /100 | #292 | Tragic 10.0% |
| Haitians | 0.0 /100 | #293 | Tragic 10.0% |
| Ecuadorians | 0.0 /100 | #294 | Tragic 10.0% |
| Cherokee | 0.0 /100 | #295 | Tragic 10.0% |
Demographics Similar to Immigrants from Scotland by Unemployment Among Women with Children Ages 6 to 17 years
In terms of unemployment among women with children ages 6 to 17 years, the demographic groups most similar to Immigrants from Scotland are Belgian (9.2%, a difference of 0.030%), Syrian (9.2%, a difference of 0.050%), German (9.2%, a difference of 0.10%), Immigrants from Germany (9.2%, a difference of 0.11%), and Immigrants from Uruguay (9.2%, a difference of 0.11%).
| Demographics | Rating | Rank | Unemployment Among Women with Children Ages 6 to 17 years |
| Peruvians | 9.0 /100 | #212 | Tragic 9.2% |
| Spaniards | 8.2 /100 | #213 | Tragic 9.2% |
| Iroquois | 7.5 /100 | #214 | Tragic 9.2% |
| Immigrants | Germany | 7.2 /100 | #215 | Tragic 9.2% |
| Immigrants | Uruguay | 7.2 /100 | #216 | Tragic 9.2% |
| Germans | 7.2 /100 | #217 | Tragic 9.2% |
| Syrians | 6.9 /100 | #218 | Tragic 9.2% |
| Immigrants | Scotland | 6.6 /100 | #219 | Tragic 9.2% |
| Belgians | 6.4 /100 | #220 | Tragic 9.2% |
| Crow | 5.8 /100 | #221 | Tragic 9.2% |
| Immigrants | Southern Europe | 5.8 /100 | #222 | Tragic 9.2% |
| Immigrants | Eritrea | 5.8 /100 | #223 | Tragic 9.2% |
| Immigrants | El Salvador | 5.3 /100 | #224 | Tragic 9.3% |
| Chinese | 5.2 /100 | #225 | Tragic 9.3% |
| Immigrants | Azores | 4.6 /100 | #226 | Tragic 9.3% |