Shoshone vs Immigrants from Scotland 1 or more Vehicles in Household
COMPARE
Shoshone
Immigrants from Scotland
1 or more Vehicles in Household
1 or more Vehicles in Household Comparison
Shoshone
Immigrants from Scotland
89.5%
1 OR MORE VEHICLES IN HOUSEHOLD
37.5/ 100
METRIC RATING
190th/ 347
METRIC RANK
91.8%
1 OR MORE VEHICLES IN HOUSEHOLD
99.7/ 100
METRIC RATING
68th/ 347
METRIC RANK
Shoshone vs Immigrants from Scotland 1 or more Vehicles in Household Correlation Chart
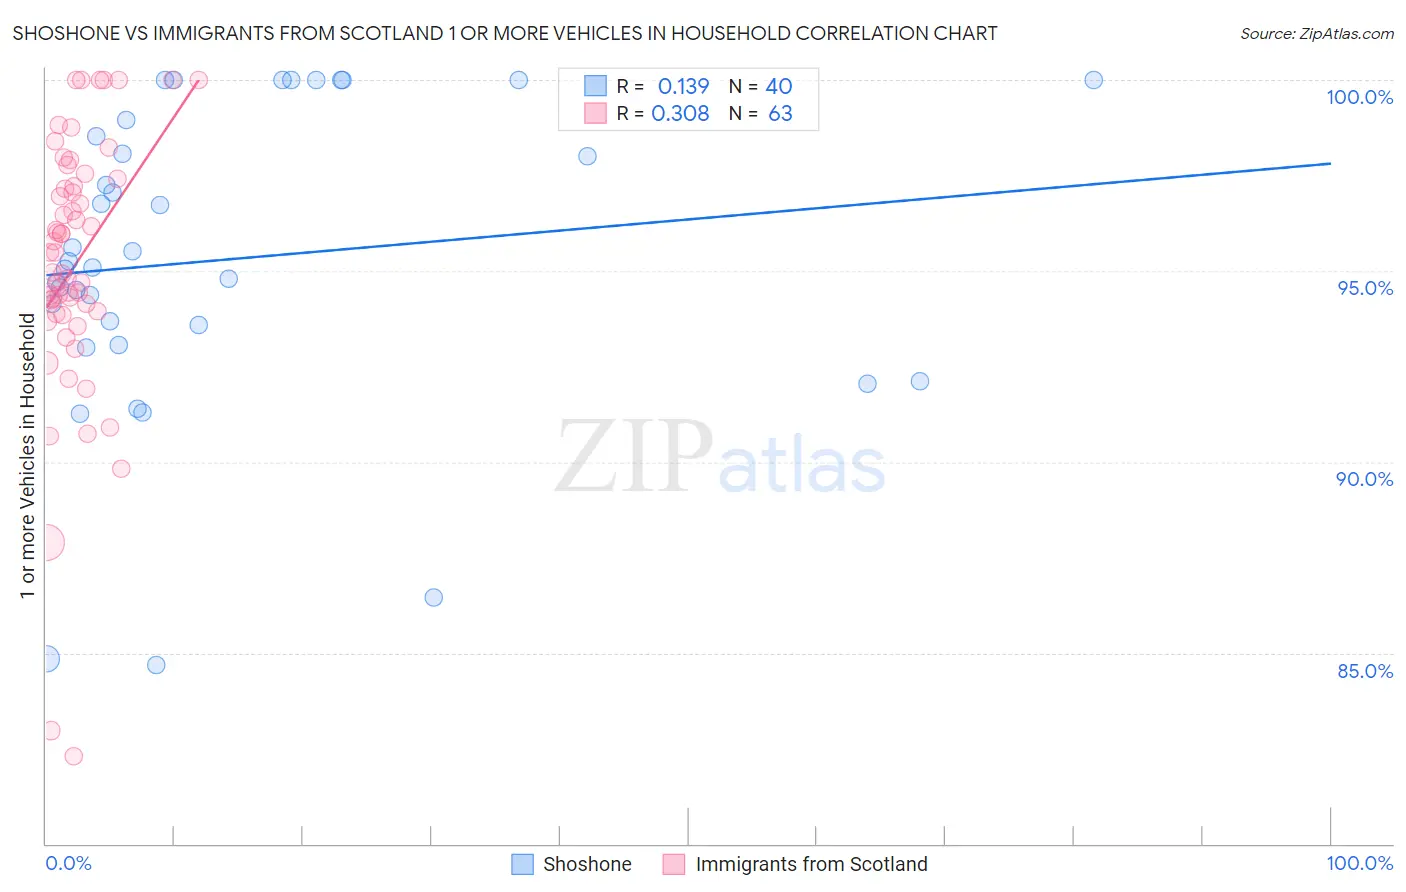
The statistical analysis conducted on geographies consisting of 66,616,007 people shows a poor positive correlation between the proportion of Shoshone and percentage of households with 1 or more vehicles available in the United States with a correlation coefficient (R) of 0.139 and weighted average of 89.5%. Similarly, the statistical analysis conducted on geographies consisting of 196,228,925 people shows a mild positive correlation between the proportion of Immigrants from Scotland and percentage of households with 1 or more vehicles available in the United States with a correlation coefficient (R) of 0.308 and weighted average of 91.8%, a difference of 2.5%.
1 or more Vehicles in Household Correlation Summary
| Measurement | Shoshone | Immigrants from Scotland |
| Minimum | 84.7% | 82.3% |
| Maximum | 100.0% | 100.0% |
| Range | 15.3% | 17.7% |
| Mean | 95.3% | 95.1% |
| Median | 95.2% | 95.5% |
| Interquartile 25% (IQ1) | 93.3% | 93.9% |
| Interquartile 75% (IQ3) | 98.7% | 97.4% |
| Interquartile Range (IQR) | 5.4% | 3.5% |
| Standard Deviation (Sample) | 4.0% | 3.5% |
| Standard Deviation (Population) | 4.0% | 3.5% |
Similar Demographics by 1 or more Vehicles in Household
Demographics Similar to Shoshone by 1 or more Vehicles in Household
In terms of 1 or more vehicles in household, the demographic groups most similar to Shoshone are Carpatho Rusyn (89.5%, a difference of 0.0%), Immigrants from Poland (89.5%, a difference of 0.010%), Immigrants from Nepal (89.5%, a difference of 0.020%), Immigrants from North Macedonia (89.5%, a difference of 0.020%), and South American (89.5%, a difference of 0.030%).
| Demographics | Rating | Rank | 1 or more Vehicles in Household |
| Ethiopians | 41.2 /100 | #183 | Average 89.6% |
| Immigrants | Bulgaria | 40.7 /100 | #184 | Average 89.6% |
| Immigrants | Brazil | 40.1 /100 | #185 | Average 89.6% |
| Pueblo | 39.9 /100 | #186 | Fair 89.6% |
| South Americans | 39.6 /100 | #187 | Fair 89.5% |
| Immigrants | Nepal | 38.9 /100 | #188 | Fair 89.5% |
| Carpatho Rusyns | 37.8 /100 | #189 | Fair 89.5% |
| Shoshone | 37.5 /100 | #190 | Fair 89.5% |
| Immigrants | Poland | 37.1 /100 | #191 | Fair 89.5% |
| Immigrants | North Macedonia | 36.5 /100 | #192 | Fair 89.5% |
| Immigrants | Northern Europe | 35.5 /100 | #193 | Fair 89.5% |
| Immigrants | Eritrea | 33.2 /100 | #194 | Fair 89.4% |
| Immigrants | Armenia | 31.8 /100 | #195 | Fair 89.4% |
| Crow | 24.3 /100 | #196 | Fair 89.3% |
| Immigrants | Sweden | 23.6 /100 | #197 | Fair 89.3% |
Demographics Similar to Immigrants from Scotland by 1 or more Vehicles in Household
In terms of 1 or more vehicles in household, the demographic groups most similar to Immigrants from Scotland are Spaniard (91.8%, a difference of 0.030%), Palestinian (91.7%, a difference of 0.040%), Canadian (91.8%, a difference of 0.060%), Lithuanian (91.7%, a difference of 0.060%), and Immigrants from Laos (91.8%, a difference of 0.080%).
| Demographics | Rating | Rank | 1 or more Vehicles in Household |
| Immigrants | India | 99.8 /100 | #61 | Exceptional 91.9% |
| Thais | 99.8 /100 | #62 | Exceptional 91.9% |
| Chinese | 99.8 /100 | #63 | Exceptional 91.9% |
| Croatians | 99.8 /100 | #64 | Exceptional 91.9% |
| Immigrants | Laos | 99.8 /100 | #65 | Exceptional 91.8% |
| Canadians | 99.8 /100 | #66 | Exceptional 91.8% |
| Spaniards | 99.8 /100 | #67 | Exceptional 91.8% |
| Immigrants | Scotland | 99.7 /100 | #68 | Exceptional 91.8% |
| Palestinians | 99.7 /100 | #69 | Exceptional 91.7% |
| Lithuanians | 99.7 /100 | #70 | Exceptional 91.7% |
| Poles | 99.7 /100 | #71 | Exceptional 91.7% |
| Cajuns | 99.7 /100 | #72 | Exceptional 91.7% |
| Immigrants | Iran | 99.7 /100 | #73 | Exceptional 91.7% |
| Immigrants | Lebanon | 99.6 /100 | #74 | Exceptional 91.6% |
| Portuguese | 99.5 /100 | #75 | Exceptional 91.6% |