Immigrants from Uzbekistan vs Hopi Female Disability
COMPARE
Immigrants from Uzbekistan
Hopi
Female Disability
Female Disability Comparison
Immigrants from Uzbekistan
Hopi
12.3%
FEMALE DISABILITY
33.9/ 100
METRIC RATING
185th/ 347
METRIC RANK
13.7%
FEMALE DISABILITY
0.0/ 100
METRIC RATING
311th/ 347
METRIC RANK
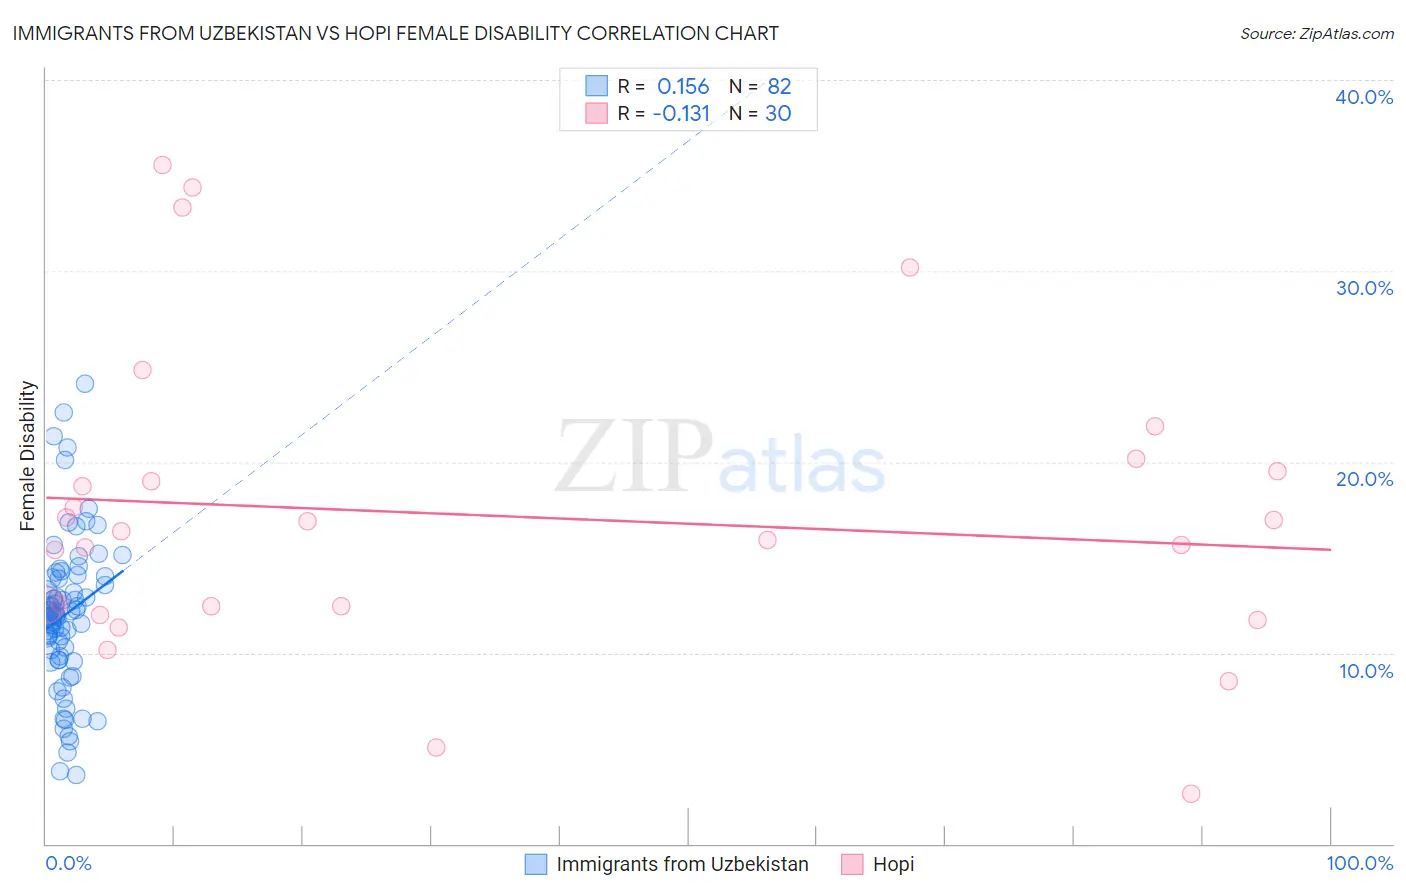
Immigrants from Uzbekistan vs Hopi Female Disability Correlation Chart
The statistical analysis conducted on geographies consisting of 118,753,500 people shows a poor positive correlation between the proportion of Immigrants from Uzbekistan and percentage of females with a disability in the United States with a correlation coefficient (R) of 0.156 and weighted average of 12.3%. Similarly, the statistical analysis conducted on geographies consisting of 74,733,138 people shows a poor negative correlation between the proportion of Hopi and percentage of females with a disability in the United States with a correlation coefficient (R) of -0.131 and weighted average of 13.7%, a difference of 12.0%.
Female Disability Correlation Summary
| Measurement | Immigrants from Uzbekistan | Hopi |
| Minimum | 3.6% | 2.6% |
| Maximum | 24.1% | 35.6% |
| Range | 20.5% | 33.0% |
| Mean | 12.0% | 17.2% |
| Median | 12.0% | 16.2% |
| Interquartile 25% (IQ1) | 9.8% | 12.4% |
| Interquartile 75% (IQ3) | 13.9% | 19.5% |
| Interquartile Range (IQR) | 4.1% | 7.1% |
| Standard Deviation (Sample) | 4.0% | 8.0% |
| Standard Deviation (Population) | 3.9% | 7.8% |
Similar Demographics by Female Disability
Demographics Similar to Immigrants from Uzbekistan by Female Disability
In terms of female disability, the demographic groups most similar to Immigrants from Uzbekistan are Austrian (12.3%, a difference of 0.020%), Serbian (12.3%, a difference of 0.030%), Immigrants from North America (12.3%, a difference of 0.050%), Iraqi (12.3%, a difference of 0.080%), and Cuban (12.3%, a difference of 0.10%).
| Demographics | Rating | Rank | Female Disability |
| Immigrants | Western Europe | 40.9 /100 | #178 | Average 12.2% |
| Immigrants | Fiji | 38.2 /100 | #179 | Fair 12.3% |
| Albanians | 37.9 /100 | #180 | Fair 12.3% |
| Immigrants | Canada | 37.2 /100 | #181 | Fair 12.3% |
| Norwegians | 36.9 /100 | #182 | Fair 12.3% |
| Cubans | 36.5 /100 | #183 | Fair 12.3% |
| Iraqis | 36.0 /100 | #184 | Fair 12.3% |
| Immigrants | Uzbekistan | 33.9 /100 | #185 | Fair 12.3% |
| Austrians | 33.3 /100 | #186 | Fair 12.3% |
| Serbians | 33.1 /100 | #187 | Fair 12.3% |
| Immigrants | North America | 32.8 /100 | #188 | Fair 12.3% |
| Immigrants | Albania | 31.6 /100 | #189 | Fair 12.3% |
| Immigrants | Honduras | 31.3 /100 | #190 | Fair 12.3% |
| Armenians | 29.7 /100 | #191 | Fair 12.3% |
| Immigrants | Western Africa | 29.2 /100 | #192 | Fair 12.3% |
Demographics Similar to Hopi by Female Disability
In terms of female disability, the demographic groups most similar to Hopi are Apache (13.7%, a difference of 0.29%), Delaware (13.8%, a difference of 0.31%), French American Indian (13.7%, a difference of 0.41%), Cree (13.7%, a difference of 0.46%), and Blackfeet (13.8%, a difference of 0.63%).
| Demographics | Rating | Rank | Female Disability |
| Immigrants | Micronesia | 0.0 /100 | #304 | Tragic 13.5% |
| Dominicans | 0.0 /100 | #305 | Tragic 13.5% |
| French Canadians | 0.0 /100 | #306 | Tragic 13.6% |
| Central American Indians | 0.0 /100 | #307 | Tragic 13.6% |
| Cree | 0.0 /100 | #308 | Tragic 13.7% |
| French American Indians | 0.0 /100 | #309 | Tragic 13.7% |
| Apache | 0.0 /100 | #310 | Tragic 13.7% |
| Hopi | 0.0 /100 | #311 | Tragic 13.7% |
| Delaware | 0.0 /100 | #312 | Tragic 13.8% |
| Blackfeet | 0.0 /100 | #313 | Tragic 13.8% |
| Puget Sound Salish | 0.0 /100 | #314 | Tragic 13.8% |
| Alaskan Athabascans | 0.0 /100 | #315 | Tragic 13.9% |
| Spanish Americans | 0.0 /100 | #316 | Tragic 14.0% |
| Chippewa | 0.0 /100 | #317 | Tragic 14.0% |
| Paiute | 0.0 /100 | #318 | Tragic 14.0% |