Immigrants from Ethiopia vs Subsaharan African Disability Age Under 5
COMPARE
Immigrants from Ethiopia
Subsaharan African
Disability Age Under 5
Disability Age Under 5 Comparison
Immigrants from Ethiopia
Sub-Saharan Africans
1.1%
DISABILITY AGE UNDER 5
99.2/ 100
METRIC RATING
61st/ 347
METRIC RANK
1.3%
DISABILITY AGE UNDER 5
8.3/ 100
METRIC RATING
221st/ 347
METRIC RANK
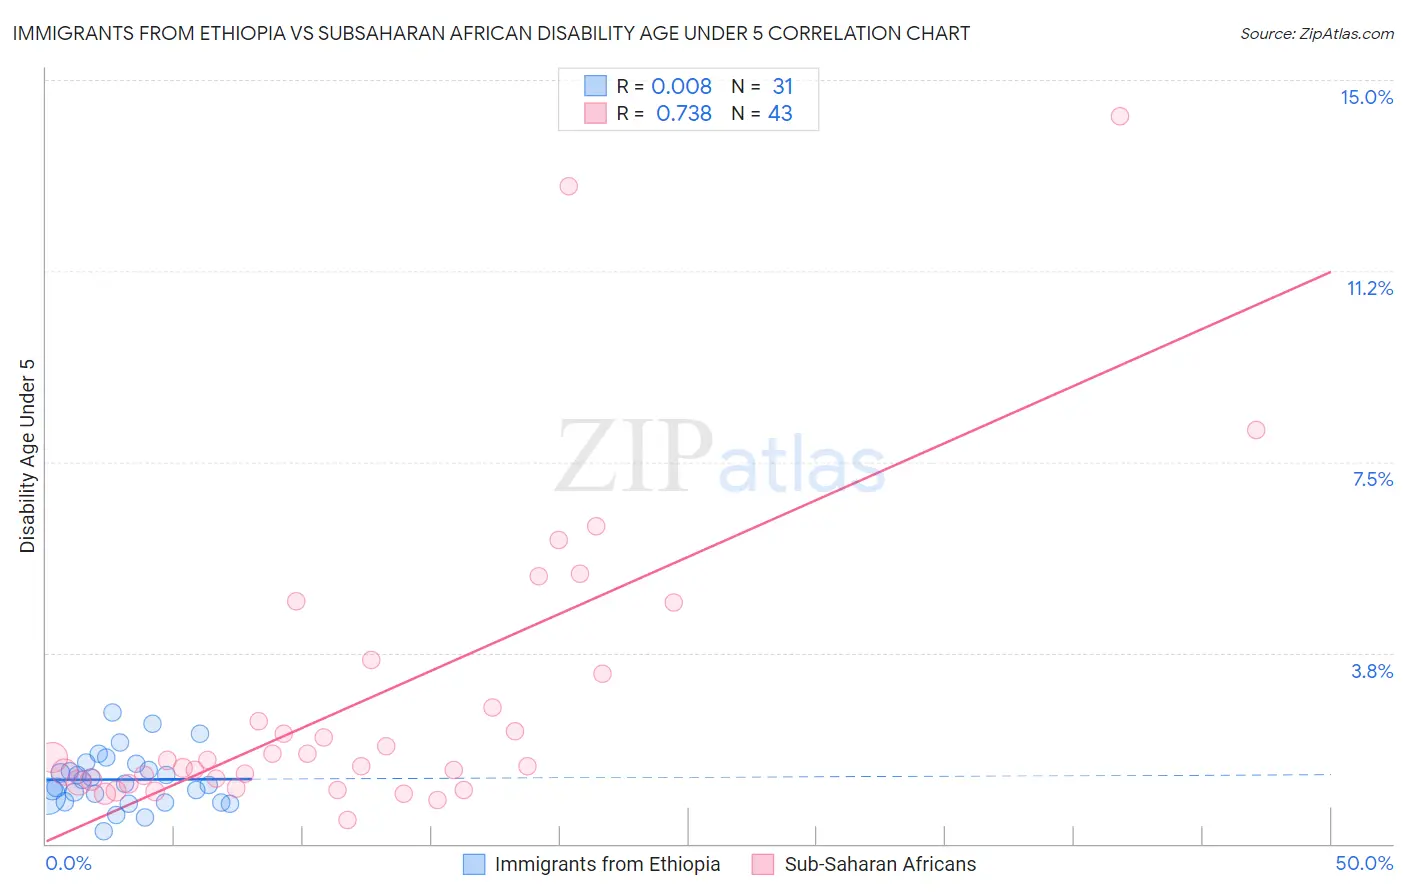
Immigrants from Ethiopia vs Subsaharan African Disability Age Under 5 Correlation Chart
The statistical analysis conducted on geographies consisting of 138,545,864 people shows no correlation between the proportion of Immigrants from Ethiopia and percentage of population with a disability under the age of 5 in the United States with a correlation coefficient (R) of 0.008 and weighted average of 1.1%. Similarly, the statistical analysis conducted on geographies consisting of 252,320,472 people shows a strong positive correlation between the proportion of Sub-Saharan Africans and percentage of population with a disability under the age of 5 in the United States with a correlation coefficient (R) of 0.738 and weighted average of 1.3%, a difference of 18.2%.
Disability Age Under 5 Correlation Summary
| Measurement | Immigrants from Ethiopia | Subsaharan African |
| Minimum | 0.25% | 0.47% |
| Maximum | 2.6% | 14.3% |
| Range | 2.3% | 13.8% |
| Mean | 1.3% | 2.8% |
| Median | 1.2% | 1.6% |
| Interquartile 25% (IQ1) | 0.83% | 1.2% |
| Interquartile 75% (IQ3) | 1.6% | 3.4% |
| Interquartile Range (IQR) | 0.74% | 2.1% |
| Standard Deviation (Sample) | 0.53% | 3.0% |
| Standard Deviation (Population) | 0.52% | 2.9% |
Similar Demographics by Disability Age Under 5
Demographics Similar to Immigrants from Ethiopia by Disability Age Under 5
In terms of disability age under 5, the demographic groups most similar to Immigrants from Ethiopia are Immigrants from Switzerland (1.1%, a difference of 0.010%), Immigrants from Western Asia (1.1%, a difference of 0.060%), Immigrants from Vietnam (1.1%, a difference of 0.12%), Egyptian (1.1%, a difference of 0.58%), and Immigrants from Malaysia (1.1%, a difference of 0.82%).
| Demographics | Rating | Rank | Disability Age Under 5 |
| Immigrants | El Salvador | 99.6 /100 | #54 | Exceptional 1.1% |
| Salvadorans | 99.5 /100 | #55 | Exceptional 1.1% |
| Ecuadorians | 99.5 /100 | #56 | Exceptional 1.1% |
| Assyrians/Chaldeans/Syriacs | 99.5 /100 | #57 | Exceptional 1.1% |
| Immigrants | Egypt | 99.4 /100 | #58 | Exceptional 1.1% |
| Immigrants | Malaysia | 99.4 /100 | #59 | Exceptional 1.1% |
| Immigrants | Western Asia | 99.2 /100 | #60 | Exceptional 1.1% |
| Immigrants | Ethiopia | 99.2 /100 | #61 | Exceptional 1.1% |
| Immigrants | Switzerland | 99.2 /100 | #62 | Exceptional 1.1% |
| Immigrants | Vietnam | 99.1 /100 | #63 | Exceptional 1.1% |
| Egyptians | 98.9 /100 | #64 | Exceptional 1.1% |
| Immigrants | Korea | 98.8 /100 | #65 | Exceptional 1.1% |
| Immigrants | Indonesia | 98.7 /100 | #66 | Exceptional 1.1% |
| Immigrants | Belize | 98.7 /100 | #67 | Exceptional 1.1% |
| South Africans | 98.7 /100 | #68 | Exceptional 1.1% |
Demographics Similar to Sub-Saharan Africans by Disability Age Under 5
In terms of disability age under 5, the demographic groups most similar to Sub-Saharan Africans are Ukrainian (1.3%, a difference of 0.0%), Hispanic or Latino (1.3%, a difference of 0.19%), Serbian (1.3%, a difference of 0.34%), Latvian (1.3%, a difference of 0.35%), and Panamanian (1.3%, a difference of 0.38%).
| Demographics | Rating | Rank | Disability Age Under 5 |
| Immigrants | Chile | 17.2 /100 | #214 | Poor 1.3% |
| Syrians | 16.1 /100 | #215 | Poor 1.3% |
| Bangladeshis | 15.5 /100 | #216 | Poor 1.3% |
| Cypriots | 14.9 /100 | #217 | Poor 1.3% |
| Malaysians | 13.2 /100 | #218 | Poor 1.3% |
| Immigrants | Croatia | 11.2 /100 | #219 | Poor 1.3% |
| Serbians | 9.6 /100 | #220 | Tragic 1.3% |
| Sub-Saharan Africans | 8.3 /100 | #221 | Tragic 1.3% |
| Ukrainians | 8.3 /100 | #222 | Tragic 1.3% |
| Hispanics or Latinos | 7.7 /100 | #223 | Tragic 1.3% |
| Latvians | 7.1 /100 | #224 | Tragic 1.3% |
| Panamanians | 7.1 /100 | #225 | Tragic 1.3% |
| Bahamians | 7.1 /100 | #226 | Tragic 1.3% |
| Taiwanese | 6.1 /100 | #227 | Tragic 1.3% |
| Luxembourgers | 6.1 /100 | #228 | Tragic 1.3% |