Seminole vs Jordanian In Labor Force | Age 20-24

COMPARE

Seminole
Race
Ancestry
AfghanAfricanAlaska NativeAlaskan AthabascanAlbanianAleutAlsatianAmericanApacheArabArapahoArgentineanArmenianAssyrian/Chaldean/SyriacAustralianAustrianBahamianBangladeshiBarbadianBasqueBelgianBelizeanBermudanBhutaneseBlackfeetBolivianBrazilianBritishBritish West IndianBulgarianBurmeseCajunCambodianCanadianCape VerdeanCarpatho RusynCelticCentral AmericanCentral American IndianCherokeeCheyenneChickasawChileanChineseChippewaChoctawColombianColvilleComancheCosta RicanCreeCreekCroatianCrowCubanCypriotCzechCzechoslovakianDanishDelawareDominicanDutchDutch West IndianEastern EuropeanEcuadorianEgyptianEnglishEstonianEthiopianEuropeanFijianFilipinoFinnishFrenchFrench American IndianFrench CanadianGermanGerman RussianGhanaianGreekGuamanian/ChamorroGuatemalanGuyaneseHaitianHmongHonduranHopiHoumaHungarianIcelanderIndian (Asian)IndonesianInupiatIranianIraqiIrishIroquoisIsraeliItalianJamaicanJapaneseKenyanKiowaKoreanLaotianLatvianLebaneseLiberianLithuanianLumbeeLuxembourgerMacedonianMalaysianMalteseMarshalleseMenomineeMexicanMexican American IndianMongolianMoroccanNative HawaiianNavajoNepaleseNew ZealanderNicaraguanNigerianNorthern EuropeanNorwegianOkinawanOsageOttawaPaiutePakistaniPalestinianPanamanianParaguayanPennsylvania GermanPeruvianPimaPolishPortuguesePotawatomiPuebloPuerto RicanPuget Sound SalishRomanianRussianSalvadoranSamoanScandinavianScotch-IrishScottishSeminoleSenegaleseSerbianShoshoneSierra LeoneanSiouxSlavicSlovakSloveneSomaliSouth AfricanSouth AmericanSouth American IndianSoviet UnionSpaniardSpanishSpanish AmericanSpanish American IndianSri LankanSubsaharan AfricanSudaneseSwedishSwissSyrianTaiwaneseThaiTlingit-HaidaTohono O'OdhamTonganTrinidadian and TobagonianTsimshianTurkishU.S. Virgin IslanderUgandanUkrainianUruguayanUteVenezuelanVietnameseWelshWest IndianYakamaYaquiYugoslavianYumanYup'ikZimbabwean
Immigration
NonimmigrantsImmigrantsAfghanistanAfricaAlbaniaArgentinaArmeniaAsiaAustraliaAustriaBahamasBangladeshBarbadosBelarusBelgiumBelizeBoliviaBosnia and HerzegovinaBrazilBulgariaBurma/MyanmarCabo VerdeCambodiaCameroonCanadaCaribbeanCentral AmericaChileChinaColombiaCongoCosta RicaCroatiaCubaCzechoslovakiaDenmarkDominicaDominican RepublicEastern AfricaEastern AsiaEastern EuropeEcuadorEgyptEl SalvadorEnglandEritreaEthiopiaEuropeFijiFranceGermanyGhanaGreeceGrenadaGuatemalaGuyanaHaitiHondurasHong KongHungaryIndiaIndonesiaIranIraqIrelandIsraelItalyJamaicaJapanJordanKazakhstanKenyaKoreaKuwaitLaosLatin AmericaLatviaLebanonLiberiaLithuaniaMalaysiaMexicoMicronesiaMiddle AfricaMoldovaMoroccoNepalNetherlandsNicaraguaNigeriaNorth AmericaNorth MacedoniaNorthern AfricaNorthern EuropeNorwayOceaniaPakistanPanamaPeruPhilippinesPolandPortugalRomaniaRussiaSaudi ArabiaScotlandSenegalSerbiaSierra LeoneSingaporeSomaliaSouth AfricaSouth AmericaSouth Central AsiaSouth Eastern AsiaSouthern EuropeSpainSri LankaSt. Vincent and the GrenadinesSudanSwedenSwitzerlandSyriaTaiwanThailandTrinidad and TobagoTurkeyUgandaUkraineUruguayUzbekistanVenezuelaVietnamWest IndiesWestern AfricaWestern AsiaWestern EuropeYemenZaireZimbabweAzores
Jordanian
Race
Ancestry
AfghanAfricanAlaska NativeAlaskan AthabascanAlbanianAleutAlsatianAmericanApacheArabArapahoArgentineanArmenianAssyrian/Chaldean/SyriacAustralianAustrianBahamianBangladeshiBarbadianBasqueBelgianBelizeanBermudanBhutaneseBlackfeetBolivianBrazilianBritishBritish West IndianBulgarianBurmeseCajunCambodianCanadianCape VerdeanCarpatho RusynCelticCentral AmericanCentral American IndianCherokeeCheyenneChickasawChileanChineseChippewaChoctawColombianColvilleComancheCosta RicanCreeCreekCroatianCrowCubanCypriotCzechCzechoslovakianDanishDelawareDominicanDutchDutch West IndianEastern EuropeanEcuadorianEgyptianEnglishEstonianEthiopianEuropeanFijianFilipinoFinnishFrenchFrench American IndianFrench CanadianGermanGerman RussianGhanaianGreekGuamanian/ChamorroGuatemalanGuyaneseHaitianHmongHonduranHopiHoumaHungarianIcelanderIndian (Asian)IndonesianInupiatIranianIraqiIrishIroquoisIsraeliItalianJamaicanJapaneseJordanianKenyanKiowaKoreanLaotianLatvianLebaneseLiberianLithuanianLumbeeLuxembourgerMacedonianMalaysianMalteseMarshalleseMenomineeMexicanMexican American IndianMongolianMoroccanNative HawaiianNavajoNepaleseNew ZealanderNicaraguanNigerianNorthern EuropeanNorwegianOkinawanOsageOttawaPaiutePakistaniPalestinianPanamanianParaguayanPennsylvania GermanPeruvianPimaPolishPortuguesePotawatomiPuebloPuerto RicanPuget Sound SalishRomanianRussianSalvadoranSamoanScandinavianScotch-IrishScottishSenegaleseSerbianShoshoneSierra LeoneanSiouxSlavicSlovakSloveneSomaliSouth AfricanSouth AmericanSouth American IndianSoviet UnionSpaniardSpanishSpanish AmericanSpanish American IndianSri LankanSubsaharan AfricanSudaneseSwedishSwissSyrianTaiwaneseThaiTlingit-HaidaTohono O'OdhamTonganTrinidadian and TobagonianTsimshianTurkishU.S. Virgin IslanderUgandanUkrainianUruguayanUteVenezuelanVietnameseWelshWest IndianYakamaYaquiYugoslavianYumanYup'ikZimbabwean
Immigration
NonimmigrantsImmigrantsAfghanistanAfricaAlbaniaArgentinaArmeniaAsiaAustraliaAustriaBahamasBangladeshBarbadosBelarusBelgiumBelizeBoliviaBosnia and HerzegovinaBrazilBulgariaBurma/MyanmarCabo VerdeCambodiaCameroonCanadaCaribbeanCentral AmericaChileChinaColombiaCongoCosta RicaCroatiaCubaCzechoslovakiaDenmarkDominicaDominican RepublicEastern AfricaEastern AsiaEastern EuropeEcuadorEgyptEl SalvadorEnglandEritreaEthiopiaEuropeFijiFranceGermanyGhanaGreeceGrenadaGuatemalaGuyanaHaitiHondurasHong KongHungaryIndiaIndonesiaIranIraqIrelandIsraelItalyJamaicaJapanJordanKazakhstanKenyaKoreaKuwaitLaosLatin AmericaLatviaLebanonLiberiaLithuaniaMalaysiaMexicoMicronesiaMiddle AfricaMoldovaMoroccoNepalNetherlandsNicaraguaNigeriaNorth AmericaNorth MacedoniaNorthern AfricaNorthern EuropeNorwayOceaniaPakistanPanamaPeruPhilippinesPolandPortugalRomaniaRussiaSaudi ArabiaScotlandSenegalSerbiaSierra LeoneSingaporeSomaliaSouth AfricaSouth AmericaSouth Central AsiaSouth Eastern AsiaSouthern EuropeSpainSri LankaSt. Vincent and the GrenadinesSudanSwedenSwitzerlandSyriaTaiwanThailandTrinidad and TobagoTurkeyUgandaUkraineUruguayUzbekistanVenezuelaVietnamWest IndiesWestern AfricaWestern AsiaWestern EuropeYemenZaireZimbabweAzores
In Labor Force | Age 20-24
Income
Poverty
Unemployment
Labor Participation
Family Structure
Vehicle Availability
Education Level
Disability

In Labor Force | Age 20-24 Comparison

Seminole

Jordanians

Tragic
Excellent
74.3%
IN LABOR FORCE | AGE 20-24
6.9/ 100
METRIC RATING
224th/ 347
METRIC RANK
75.5%
IN LABOR FORCE | AGE 20-24
84.8/ 100
METRIC RATING
137th/ 347
METRIC RANK

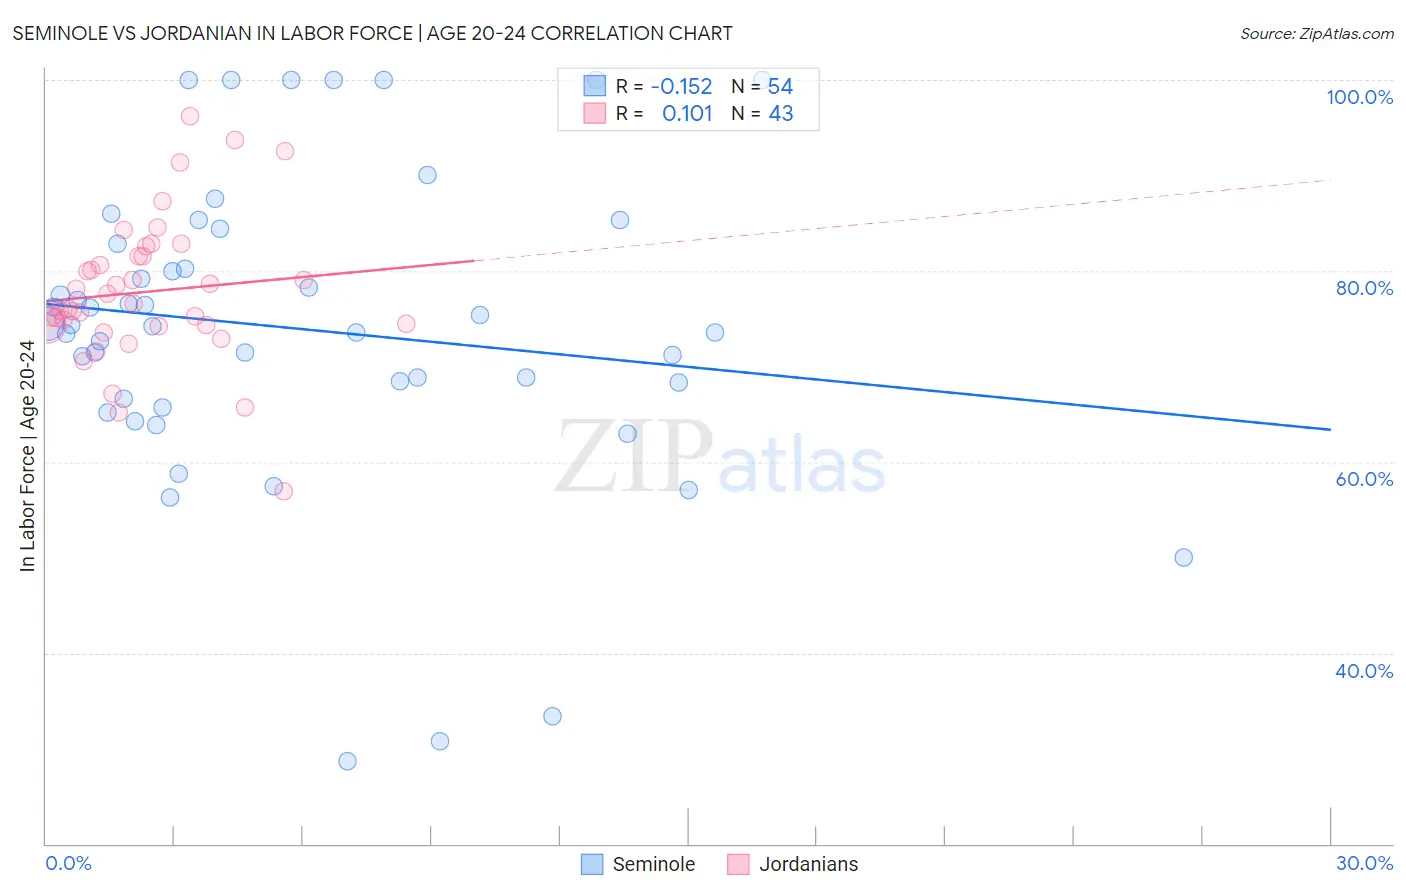
Seminole vs Jordanian In Labor Force | Age 20-24 Correlation Chart

The statistical analysis conducted on geographies consisting of 118,300,066 people shows a poor negative correlation between the proportion of Seminole and labor force participation rate among population between the ages 20 and 24 in the United States with a correlation coefficient (R) of -0.152 and weighted average of 74.3%. Similarly, the statistical analysis conducted on geographies consisting of 166,409,280 people shows a poor positive correlation between the proportion of Jordanians and labor force participation rate among population between the ages 20 and 24 in the United States with a correlation coefficient (R) of 0.101 and weighted average of 75.5%, a difference of 1.6%.
Seminole vs Jordanian In Labor Force | Age 20-24

In Labor Force | Age 20-24 Correlation Summary

MeasurementSeminoleJordanian
Minimum28.6%56.9%
Maximum100.0%96.2%
Range71.4%39.3%
Mean73.9%77.8%
Median74.3%76.6%
Interquartile 25% (IQ1)66.6%74.3%
Interquartile 75% (IQ3)82.9%81.6%
Interquartile Range (IQR)16.3%7.3%
Standard Deviation (Sample)16.2%7.6%
Standard Deviation (Population)16.0%7.5%

Similar Demographics by In Labor Force | Age 20-24

Demographics Similar to Seminole by In Labor Force | Age 20-24

In terms of in labor force | age 20-24, the demographic groups most similar to Seminole are Ghanaian (74.3%, a difference of 0.040%), Hispanic or Latino (74.4%, a difference of 0.060%), Immigrants from Fiji (74.3%, a difference of 0.060%), Immigrants from Ireland (74.3%, a difference of 0.070%), and Immigrants from Ukraine (74.2%, a difference of 0.12%).
DemographicsRating | RankIn Labor Force | Age 20-24
Chileans
12.5
/100
|
#217
Poor
74.5%
Immigrants | Peru
10.6
/100
|
#218
Poor
74.5%
Nepalese
10.5
/100
|
#219
Poor
74.5%
Immigrants | Norway
10.3
/100
|
#220
Poor
74.5%
Chickasaw
10.3
/100
|
#221
Poor
74.5%
Immigrants | India
9.9
/100
|
#222
Tragic
74.4%
Hispanics or Latinos
7.9
/100
|
#223
Tragic
74.4%
Seminole
6.9
/100
|
#224
Tragic
74.3%
Ghanaians
6.2
/100
|
#225
Tragic
74.3%
Immigrants | Fiji
5.9
/100
|
#226
Tragic
74.3%
Immigrants | Ireland
5.8
/100
|
#227
Tragic
74.3%
Immigrants | Ukraine
5.1
/100
|
#228
Tragic
74.2%
Immigrants | Sweden
4.6
/100
|
#229
Tragic
74.2%
Immigrants | Albania
4.3
/100
|
#230
Tragic
74.2%
Immigrants | Greece
4.1
/100
|
#231
Tragic
74.2%

Demographics Similar to Jordanians by In Labor Force | Age 20-24

In terms of in labor force | age 20-24, the demographic groups most similar to Jordanians are Immigrants from Brazil (75.5%, a difference of 0.0%), Australian (75.5%, a difference of 0.0%), Immigrants from England (75.5%, a difference of 0.010%), Delaware (75.5%, a difference of 0.010%), and Yaqui (75.5%, a difference of 0.020%).
DemographicsRating | RankIn Labor Force | Age 20-24
Immigrants | Austria
88.8
/100
|
#130
Excellent
75.6%
Immigrants | Jordan
88.5
/100
|
#131
Excellent
75.6%
Palestinians
88.4
/100
|
#132
Excellent
75.6%
Zimbabweans
88.2
/100
|
#133
Excellent
75.6%
Estonians
87.1
/100
|
#134
Excellent
75.6%
Yaqui
85.5
/100
|
#135
Excellent
75.5%
Immigrants | Brazil
84.8
/100
|
#136
Excellent
75.5%
Jordanians
84.8
/100
|
#137
Excellent
75.5%
Australians
84.8
/100
|
#138
Excellent
75.5%
Immigrants | England
84.6
/100
|
#139
Excellent
75.5%
Delaware
84.5
/100
|
#140
Excellent
75.5%
Romanians
84.1
/100
|
#141
Excellent
75.5%
Blackfeet
83.6
/100
|
#142
Excellent
75.5%
Spaniards
82.0
/100
|
#143
Excellent
75.5%
Bhutanese
80.8
/100
|
#144
Excellent
75.4%