Senegalese vs Immigrants from Vietnam Disability Age Under 5
COMPARE
Senegalese
Immigrants from Vietnam
Disability Age Under 5
Disability Age Under 5 Comparison
Senegalese
Immigrants from Vietnam
1.2%
DISABILITY AGE UNDER 5
94.6/ 100
METRIC RATING
111th/ 347
METRIC RANK
1.1%
DISABILITY AGE UNDER 5
99.1/ 100
METRIC RATING
63rd/ 347
METRIC RANK
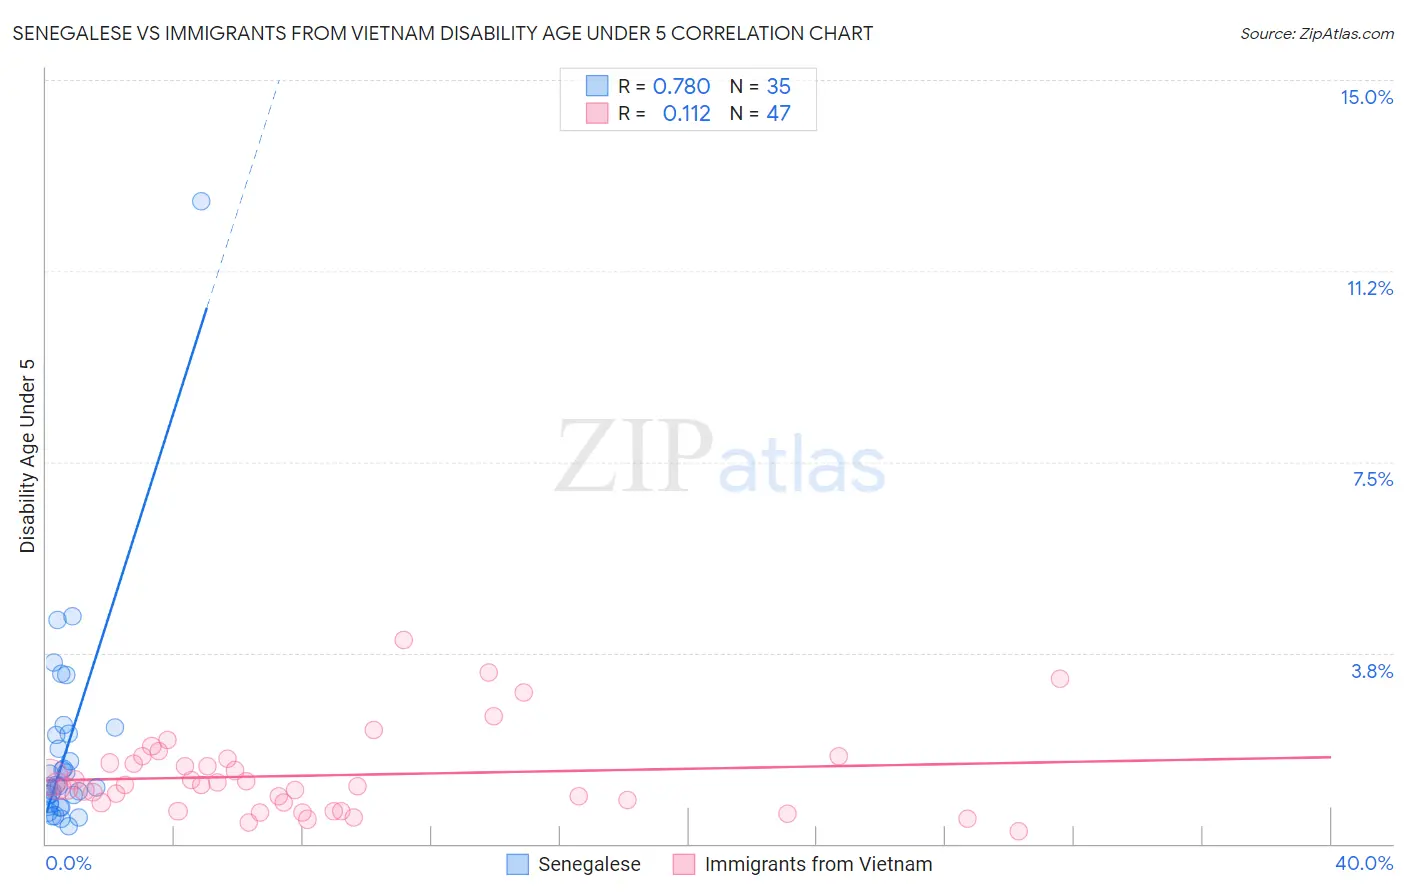
Senegalese vs Immigrants from Vietnam Disability Age Under 5 Correlation Chart
The statistical analysis conducted on geographies consisting of 62,306,904 people shows a strong positive correlation between the proportion of Senegalese and percentage of population with a disability under the age of 5 in the United States with a correlation coefficient (R) of 0.780 and weighted average of 1.2%. Similarly, the statistical analysis conducted on geographies consisting of 220,992,476 people shows a poor positive correlation between the proportion of Immigrants from Vietnam and percentage of population with a disability under the age of 5 in the United States with a correlation coefficient (R) of 0.112 and weighted average of 1.1%, a difference of 4.7%.
Disability Age Under 5 Correlation Summary
| Measurement | Senegalese | Immigrants from Vietnam |
| Minimum | 0.35% | 0.25% |
| Maximum | 12.6% | 4.0% |
| Range | 12.3% | 3.8% |
| Mean | 1.9% | 1.3% |
| Median | 1.1% | 1.1% |
| Interquartile 25% (IQ1) | 0.77% | 0.81% |
| Interquartile 75% (IQ3) | 2.2% | 1.7% |
| Interquartile Range (IQR) | 1.4% | 0.87% |
| Standard Deviation (Sample) | 2.2% | 0.81% |
| Standard Deviation (Population) | 2.1% | 0.80% |
Similar Demographics by Disability Age Under 5
Demographics Similar to Senegalese by Disability Age Under 5
In terms of disability age under 5, the demographic groups most similar to Senegalese are Immigrants from Australia (1.2%, a difference of 0.11%), Immigrants from Oceania (1.2%, a difference of 0.17%), Immigrants from Lebanon (1.2%, a difference of 0.20%), Immigrants from Panama (1.2%, a difference of 0.22%), and Iraqi (1.2%, a difference of 0.24%).
| Demographics | Rating | Rank | Disability Age Under 5 |
| Indonesians | 95.9 /100 | #104 | Exceptional 1.2% |
| Immigrants | South Africa | 95.6 /100 | #105 | Exceptional 1.2% |
| Cambodians | 95.4 /100 | #106 | Exceptional 1.2% |
| Immigrants | West Indies | 95.3 /100 | #107 | Exceptional 1.2% |
| Iraqis | 95.1 /100 | #108 | Exceptional 1.2% |
| Immigrants | Panama | 95.0 /100 | #109 | Exceptional 1.2% |
| Immigrants | Lebanon | 95.0 /100 | #110 | Exceptional 1.2% |
| Senegalese | 94.6 /100 | #111 | Exceptional 1.2% |
| Immigrants | Australia | 94.4 /100 | #112 | Exceptional 1.2% |
| Immigrants | Oceania | 94.2 /100 | #113 | Exceptional 1.2% |
| Belizeans | 93.9 /100 | #114 | Exceptional 1.2% |
| Immigrants | Caribbean | 93.8 /100 | #115 | Exceptional 1.2% |
| Immigrants | Northern Africa | 93.8 /100 | #116 | Exceptional 1.2% |
| Immigrants | Philippines | 93.5 /100 | #117 | Exceptional 1.2% |
| Immigrants | Venezuela | 93.4 /100 | #118 | Exceptional 1.2% |
Demographics Similar to Immigrants from Vietnam by Disability Age Under 5
In terms of disability age under 5, the demographic groups most similar to Immigrants from Vietnam are Immigrants from Switzerland (1.1%, a difference of 0.11%), Immigrants from Ethiopia (1.1%, a difference of 0.12%), Immigrants from Western Asia (1.1%, a difference of 0.18%), Egyptian (1.1%, a difference of 0.46%), and Immigrants from Korea (1.1%, a difference of 0.80%).
| Demographics | Rating | Rank | Disability Age Under 5 |
| Ecuadorians | 99.5 /100 | #56 | Exceptional 1.1% |
| Assyrians/Chaldeans/Syriacs | 99.5 /100 | #57 | Exceptional 1.1% |
| Immigrants | Egypt | 99.4 /100 | #58 | Exceptional 1.1% |
| Immigrants | Malaysia | 99.4 /100 | #59 | Exceptional 1.1% |
| Immigrants | Western Asia | 99.2 /100 | #60 | Exceptional 1.1% |
| Immigrants | Ethiopia | 99.2 /100 | #61 | Exceptional 1.1% |
| Immigrants | Switzerland | 99.2 /100 | #62 | Exceptional 1.1% |
| Immigrants | Vietnam | 99.1 /100 | #63 | Exceptional 1.1% |
| Egyptians | 98.9 /100 | #64 | Exceptional 1.1% |
| Immigrants | Korea | 98.8 /100 | #65 | Exceptional 1.1% |
| Immigrants | Indonesia | 98.7 /100 | #66 | Exceptional 1.1% |
| Immigrants | Belize | 98.7 /100 | #67 | Exceptional 1.1% |
| South Africans | 98.7 /100 | #68 | Exceptional 1.1% |
| Israelis | 98.7 /100 | #69 | Exceptional 1.1% |
| Immigrants | Ecuador | 98.6 /100 | #70 | Exceptional 1.1% |