Scottish vs Bolivian Disability Age Under 5
COMPARE
Scottish
Bolivian
Disability Age Under 5
Disability Age Under 5 Comparison
Scottish
Bolivians
1.6%
DISABILITY AGE UNDER 5
0.0/ 100
METRIC RATING
307th/ 347
METRIC RANK
1.0%
DISABILITY AGE UNDER 5
99.9/ 100
METRIC RATING
33rd/ 347
METRIC RANK
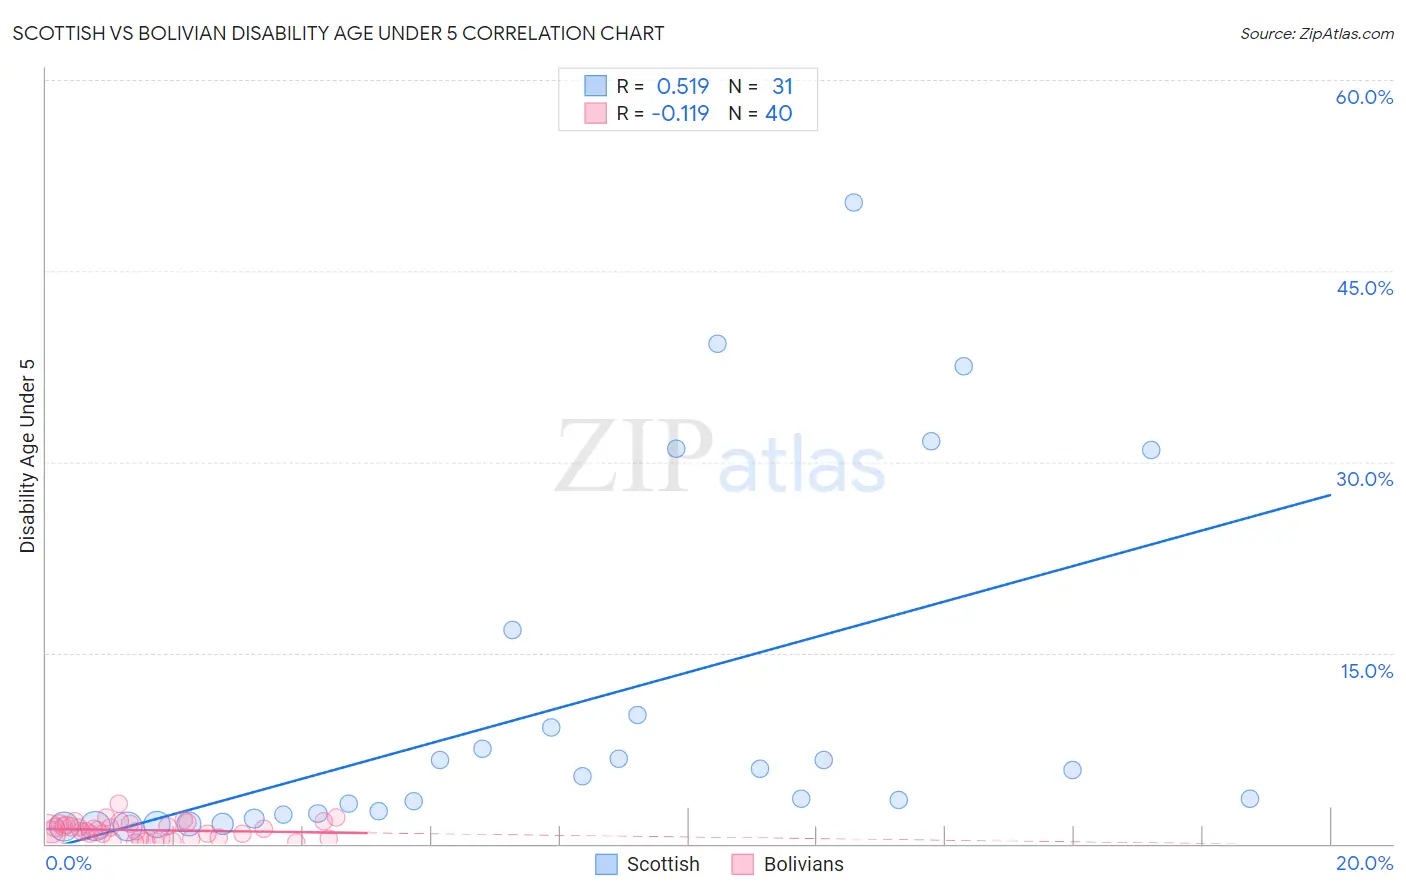
Scottish vs Bolivian Disability Age Under 5 Correlation Chart
The statistical analysis conducted on geographies consisting of 258,599,259 people shows a substantial positive correlation between the proportion of Scottish and percentage of population with a disability under the age of 5 in the United States with a correlation coefficient (R) of 0.519 and weighted average of 1.6%. Similarly, the statistical analysis conducted on geographies consisting of 123,464,586 people shows a poor negative correlation between the proportion of Bolivians and percentage of population with a disability under the age of 5 in the United States with a correlation coefficient (R) of -0.119 and weighted average of 1.0%, a difference of 59.4%.
Disability Age Under 5 Correlation Summary
| Measurement | Scottish | Bolivian |
| Minimum | 1.4% | 0.078% |
| Maximum | 50.4% | 3.2% |
| Range | 49.0% | 3.1% |
| Mean | 10.8% | 1.1% |
| Median | 5.3% | 1.0% |
| Interquartile 25% (IQ1) | 2.3% | 0.47% |
| Interquartile 75% (IQ3) | 10.1% | 1.5% |
| Interquartile Range (IQR) | 7.8% | 1.1% |
| Standard Deviation (Sample) | 13.7% | 0.67% |
| Standard Deviation (Population) | 13.4% | 0.66% |
Similar Demographics by Disability Age Under 5
Demographics Similar to Scottish by Disability Age Under 5
In terms of disability age under 5, the demographic groups most similar to Scottish are Creek (1.6%, a difference of 0.070%), Blackfeet (1.6%, a difference of 0.10%), Navajo (1.6%, a difference of 0.14%), Seminole (1.6%, a difference of 0.26%), and Cape Verdean (1.7%, a difference of 0.77%).
| Demographics | Rating | Rank | Disability Age Under 5 |
| Shoshone | 0.0 /100 | #300 | Tragic 1.6% |
| German Russians | 0.0 /100 | #301 | Tragic 1.6% |
| Welsh | 0.0 /100 | #302 | Tragic 1.6% |
| Swiss | 0.0 /100 | #303 | Tragic 1.6% |
| Seminole | 0.0 /100 | #304 | Tragic 1.6% |
| Blackfeet | 0.0 /100 | #305 | Tragic 1.6% |
| Creek | 0.0 /100 | #306 | Tragic 1.6% |
| Scottish | 0.0 /100 | #307 | Tragic 1.6% |
| Navajo | 0.0 /100 | #308 | Tragic 1.6% |
| Cape Verdeans | 0.0 /100 | #309 | Tragic 1.7% |
| Whites/Caucasians | 0.0 /100 | #310 | Tragic 1.7% |
| English | 0.0 /100 | #311 | Tragic 1.7% |
| Puerto Ricans | 0.0 /100 | #312 | Tragic 1.7% |
| Celtics | 0.0 /100 | #313 | Tragic 1.7% |
| Norwegians | 0.0 /100 | #314 | Tragic 1.7% |
Demographics Similar to Bolivians by Disability Age Under 5
In terms of disability age under 5, the demographic groups most similar to Bolivians are Immigrants from Ukraine (1.0%, a difference of 0.12%), Iranian (1.0%, a difference of 0.17%), Armenian (1.0%, a difference of 0.22%), Barbadian (1.0%, a difference of 0.36%), and Immigrants from South Central Asia (1.0%, a difference of 0.51%).
| Demographics | Rating | Rank | Disability Age Under 5 |
| Immigrants | Taiwan | 100.0 /100 | #26 | Exceptional 1.0% |
| Guyanese | 100.0 /100 | #27 | Exceptional 1.0% |
| Immigrants | Eastern Asia | 100.0 /100 | #28 | Exceptional 1.0% |
| Immigrants | Belarus | 100.0 /100 | #29 | Exceptional 1.0% |
| Immigrants | South Central Asia | 99.9 /100 | #30 | Exceptional 1.0% |
| Armenians | 99.9 /100 | #31 | Exceptional 1.0% |
| Iranians | 99.9 /100 | #32 | Exceptional 1.0% |
| Bolivians | 99.9 /100 | #33 | Exceptional 1.0% |
| Immigrants | Ukraine | 99.9 /100 | #34 | Exceptional 1.0% |
| Barbadians | 99.9 /100 | #35 | Exceptional 1.0% |
| Immigrants | Nepal | 99.9 /100 | #36 | Exceptional 1.0% |
| Immigrants | India | 99.9 /100 | #37 | Exceptional 1.0% |
| Immigrants | Guyana | 99.9 /100 | #38 | Exceptional 1.0% |
| Filipinos | 99.9 /100 | #39 | Exceptional 1.1% |
| Immigrants | Albania | 99.9 /100 | #40 | Exceptional 1.1% |