Aleut vs Immigrants from Germany Female Disability
COMPARE
Aleut
Immigrants from Germany
Female Disability
Female Disability Comparison
Aleuts
Immigrants from Germany
12.7%
FEMALE DISABILITY
1.1/ 100
METRIC RATING
258th/ 347
METRIC RANK
12.7%
FEMALE DISABILITY
1.3/ 100
METRIC RATING
255th/ 347
METRIC RANK
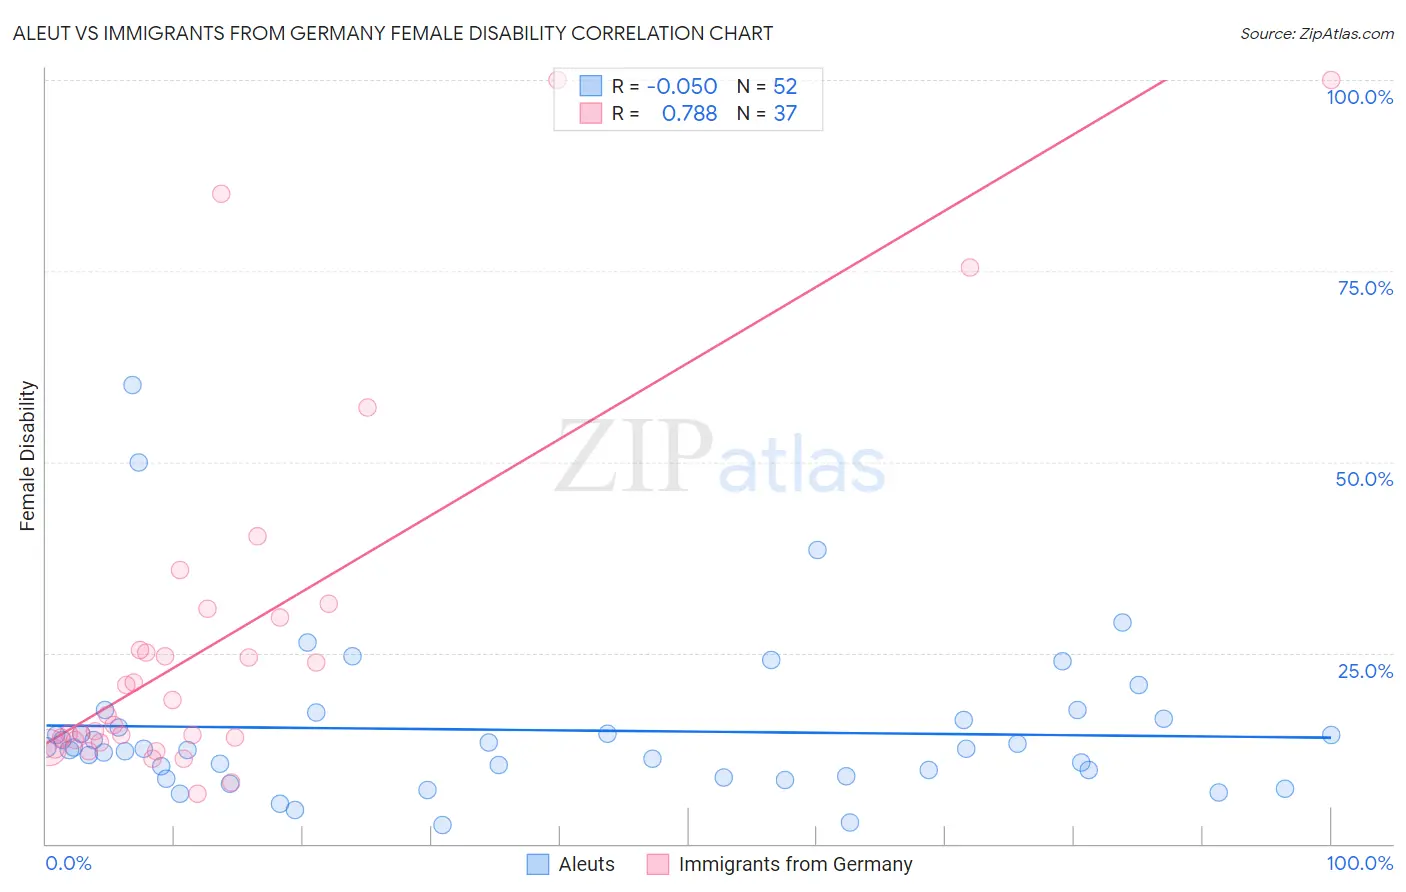
Aleut vs Immigrants from Germany Female Disability Correlation Chart
The statistical analysis conducted on geographies consisting of 61,781,040 people shows no correlation between the proportion of Aleuts and percentage of females with a disability in the United States with a correlation coefficient (R) of -0.050 and weighted average of 12.7%. Similarly, the statistical analysis conducted on geographies consisting of 463,857,992 people shows a strong positive correlation between the proportion of Immigrants from Germany and percentage of females with a disability in the United States with a correlation coefficient (R) of 0.788 and weighted average of 12.7%, a difference of 0.10%.
Female Disability Correlation Summary
| Measurement | Aleut | Immigrants from Germany |
| Minimum | 2.5% | 6.6% |
| Maximum | 60.0% | 100.0% |
| Range | 57.5% | 93.4% |
| Mean | 14.9% | 27.4% |
| Median | 12.5% | 16.9% |
| Interquartile 25% (IQ1) | 9.2% | 13.4% |
| Interquartile 75% (IQ3) | 16.2% | 30.2% |
| Interquartile Range (IQR) | 7.0% | 16.8% |
| Standard Deviation (Sample) | 10.5% | 24.5% |
| Standard Deviation (Population) | 10.4% | 24.2% |
Demographics Similar to Aleuts and Immigrants from Germany by Female Disability
In terms of female disability, the demographic groups most similar to Aleuts are Liberian (12.7%, a difference of 0.0%), British West Indian (12.7%, a difference of 0.030%), Immigrants from Armenia (12.7%, a difference of 0.080%), Subsaharan African (12.7%, a difference of 0.090%), and Bermudan (12.7%, a difference of 0.14%). Similarly, the demographic groups most similar to Immigrants from Germany are British West Indian (12.7%, a difference of 0.070%), Hawaiian (12.7%, a difference of 0.080%), Liberian (12.7%, a difference of 0.10%), Jamaican (12.7%, a difference of 0.11%), and Immigrants from Caribbean (12.7%, a difference of 0.12%).
| Demographics | Rating | Rank | Female Disability |
| Spanish American Indians | 2.1 /100 | #246 | Tragic 12.6% |
| Menominee | 2.1 /100 | #247 | Tragic 12.6% |
| Carpatho Rusyns | 2.0 /100 | #248 | Tragic 12.6% |
| Immigrants | Congo | 1.8 /100 | #249 | Tragic 12.7% |
| Slovenes | 1.7 /100 | #250 | Tragic 12.7% |
| Crow | 1.6 /100 | #251 | Tragic 12.7% |
| Immigrants | Caribbean | 1.4 /100 | #252 | Tragic 12.7% |
| Jamaicans | 1.4 /100 | #253 | Tragic 12.7% |
| Hawaiians | 1.4 /100 | #254 | Tragic 12.7% |
| Immigrants | Germany | 1.3 /100 | #255 | Tragic 12.7% |
| British West Indians | 1.2 /100 | #256 | Tragic 12.7% |
| Liberians | 1.1 /100 | #257 | Tragic 12.7% |
| Aleuts | 1.1 /100 | #258 | Tragic 12.7% |
| Immigrants | Armenia | 1.0 /100 | #259 | Tragic 12.7% |
| Sub-Saharan Africans | 1.0 /100 | #260 | Tragic 12.7% |
| Bermudans | 1.0 /100 | #261 | Tragic 12.7% |
| Czechoslovakians | 0.9 /100 | #262 | Tragic 12.7% |
| Spaniards | 0.7 /100 | #263 | Tragic 12.8% |
| Alaska Natives | 0.6 /100 | #264 | Tragic 12.8% |
| West Indians | 0.5 /100 | #265 | Tragic 12.8% |
| Finns | 0.4 /100 | #266 | Tragic 12.8% |