Scottish vs Immigrants from Germany Householder Income Over 65 years
COMPARE
Scottish
Immigrants from Germany
Householder Income Over 65 years
Householder Income Over 65 years Comparison
Scottish
Immigrants from Germany
$61,735
HOUSEHOLDER INCOME OVER 65 YEARS
69.1/ 100
METRIC RATING
149th/ 347
METRIC RANK
$62,544
HOUSEHOLDER INCOME OVER 65 YEARS
83.9/ 100
METRIC RATING
132nd/ 347
METRIC RANK
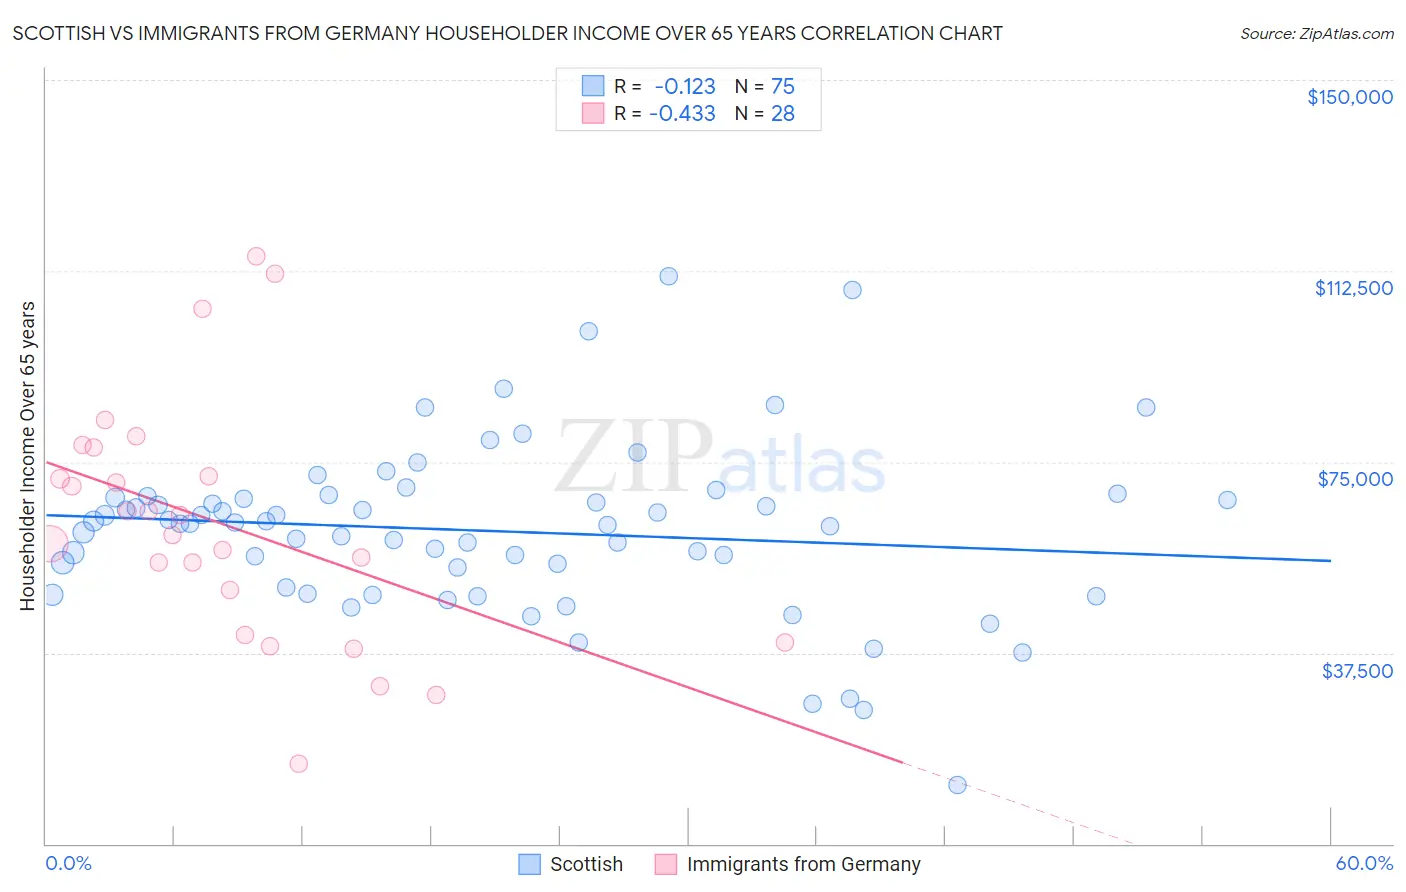
Scottish vs Immigrants from Germany Householder Income Over 65 years Correlation Chart
The statistical analysis conducted on geographies consisting of 561,942,660 people shows a poor negative correlation between the proportion of Scottish and household income with householder over the age of 65 in the United States with a correlation coefficient (R) of -0.123 and weighted average of $61,735. Similarly, the statistical analysis conducted on geographies consisting of 462,250,786 people shows a moderate negative correlation between the proportion of Immigrants from Germany and household income with householder over the age of 65 in the United States with a correlation coefficient (R) of -0.433 and weighted average of $62,544, a difference of 1.3%.
Householder Income Over 65 years Correlation Summary
| Measurement | Scottish | Immigrants from Germany |
| Minimum | $11,480 | $15,625 |
| Maximum | $111,394 | $115,357 |
| Range | $99,914 | $99,732 |
| Mean | $61,439 | $62,831 |
| Median | $62,867 | $62,572 |
| Interquartile 25% (IQ1) | $50,429 | $45,444 |
| Interquartile 75% (IQ3) | $67,901 | $74,989 |
| Interquartile Range (IQR) | $17,472 | $29,545 |
| Standard Deviation (Sample) | $16,892 | $23,868 |
| Standard Deviation (Population) | $16,779 | $23,438 |
Demographics Similar to Scottish and Immigrants from Germany by Householder Income Over 65 years
In terms of householder income over 65 years, the demographic groups most similar to Scottish are Slavic ($61,709, a difference of 0.040%), Alsatian ($61,797, a difference of 0.10%), Immigrants from Nepal ($61,843, a difference of 0.17%), Immigrants from Southern Europe ($61,902, a difference of 0.27%), and Immigrants from Uganda ($61,976, a difference of 0.39%). Similarly, the demographic groups most similar to Immigrants from Germany are Immigrants from Northern Africa ($62,522, a difference of 0.040%), Immigrants from Western Asia ($62,645, a difference of 0.16%), Basque ($62,653, a difference of 0.17%), Immigrants from Brazil ($62,364, a difference of 0.29%), and Immigrants from Chile ($62,354, a difference of 0.31%).
| Demographics | Rating | Rank | Householder Income Over 65 years |
| Basques | 85.4 /100 | #130 | Excellent $62,653 |
| Immigrants | Western Asia | 85.3 /100 | #131 | Excellent $62,645 |
| Immigrants | Germany | 83.9 /100 | #132 | Excellent $62,544 |
| Immigrants | Northern Africa | 83.6 /100 | #133 | Excellent $62,522 |
| Immigrants | Brazil | 81.2 /100 | #134 | Excellent $62,364 |
| Immigrants | Chile | 81.0 /100 | #135 | Excellent $62,354 |
| Alaskan Athabascans | 80.6 /100 | #136 | Excellent $62,330 |
| Immigrants | Syria | 80.2 /100 | #137 | Excellent $62,303 |
| Immigrants | Kazakhstan | 80.0 /100 | #138 | Excellent $62,292 |
| Lebanese | 79.9 /100 | #139 | Good $62,287 |
| Arabs | 79.6 /100 | #140 | Good $62,266 |
| Canadians | 79.0 /100 | #141 | Good $62,230 |
| South American Indians | 78.7 /100 | #142 | Good $62,215 |
| Immigrants | Belarus | 77.8 /100 | #143 | Good $62,162 |
| Immigrants | Peru | 74.4 /100 | #144 | Good $61,988 |
| Immigrants | Uganda | 74.2 /100 | #145 | Good $61,976 |
| Immigrants | Southern Europe | 72.7 /100 | #146 | Good $61,902 |
| Immigrants | Nepal | 71.4 /100 | #147 | Good $61,843 |
| Alsatians | 70.5 /100 | #148 | Good $61,797 |
| Scottish | 69.1 /100 | #149 | Good $61,735 |
| Slavs | 68.5 /100 | #150 | Good $61,709 |