Black/African American vs Immigrants from Germany Female Disability
COMPARE
Black/African American
Immigrants from Germany
Female Disability
Female Disability Comparison
Blacks/African Americans
Immigrants from Germany
14.1%
FEMALE DISABILITY
0.0/ 100
METRIC RATING
323rd/ 347
METRIC RANK
12.7%
FEMALE DISABILITY
1.3/ 100
METRIC RATING
255th/ 347
METRIC RANK
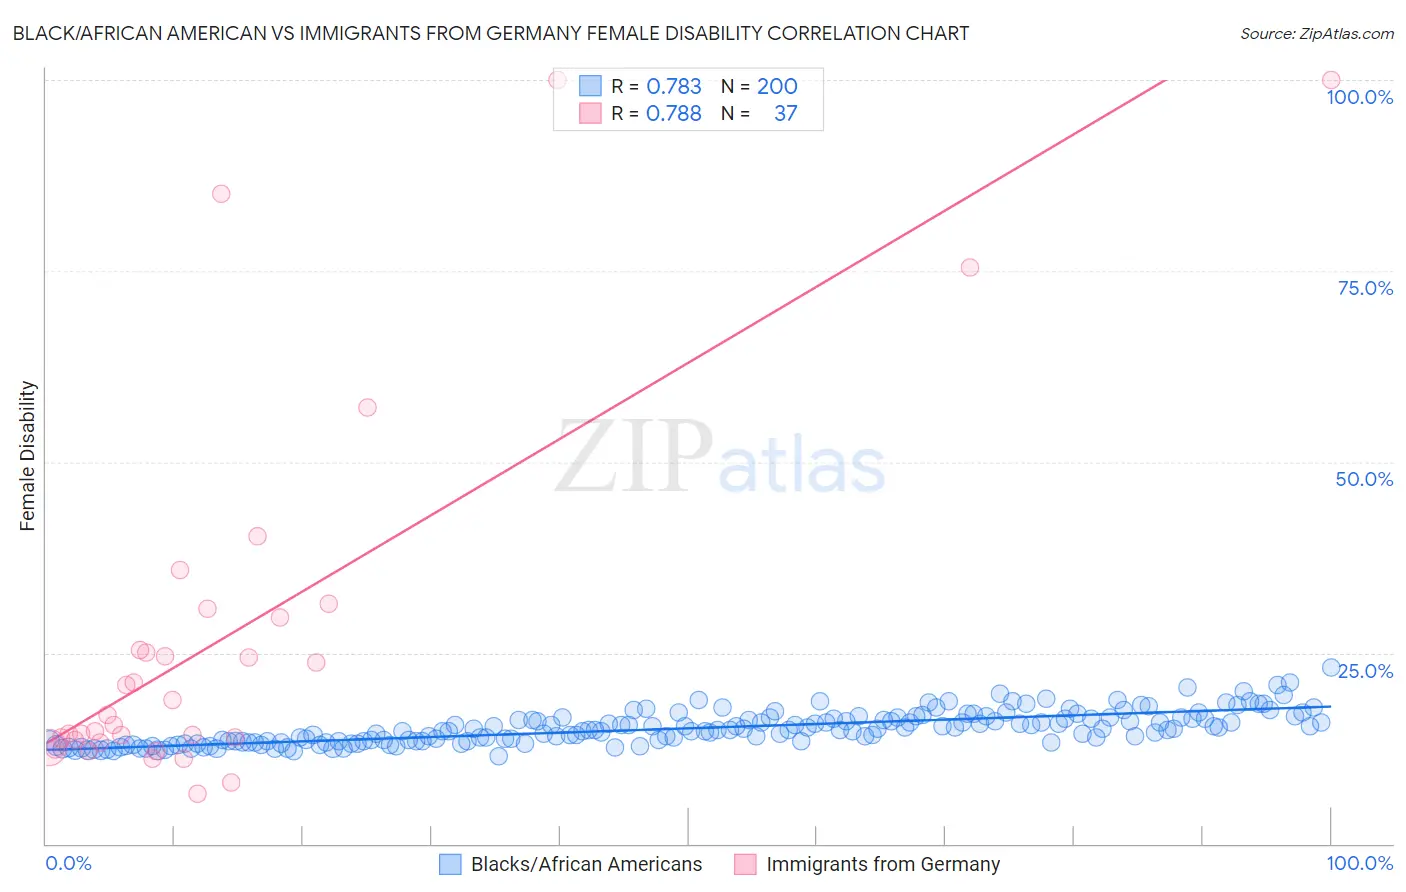
Black/African American vs Immigrants from Germany Female Disability Correlation Chart
The statistical analysis conducted on geographies consisting of 565,768,097 people shows a strong positive correlation between the proportion of Blacks/African Americans and percentage of females with a disability in the United States with a correlation coefficient (R) of 0.783 and weighted average of 14.1%. Similarly, the statistical analysis conducted on geographies consisting of 463,857,992 people shows a strong positive correlation between the proportion of Immigrants from Germany and percentage of females with a disability in the United States with a correlation coefficient (R) of 0.788 and weighted average of 12.7%, a difference of 11.4%.
Female Disability Correlation Summary
| Measurement | Black/African American | Immigrants from Germany |
| Minimum | 11.4% | 6.6% |
| Maximum | 23.1% | 100.0% |
| Range | 11.6% | 93.4% |
| Mean | 15.1% | 27.4% |
| Median | 14.9% | 16.9% |
| Interquartile 25% (IQ1) | 13.4% | 13.4% |
| Interquartile 75% (IQ3) | 16.4% | 30.2% |
| Interquartile Range (IQR) | 3.0% | 16.8% |
| Standard Deviation (Sample) | 2.1% | 24.5% |
| Standard Deviation (Population) | 2.1% | 24.2% |
Similar Demographics by Female Disability
Demographics Similar to Blacks/African Americans by Female Disability
In terms of female disability, the demographic groups most similar to Blacks/African Americans are Native/Alaskan (14.1%, a difference of 0.020%), Navajo (14.2%, a difference of 0.16%), Pueblo (14.1%, a difference of 0.17%), Potawatomi (14.1%, a difference of 0.18%), and Comanche (14.2%, a difference of 0.27%).
| Demographics | Rating | Rank | Female Disability |
| Spanish Americans | 0.0 /100 | #316 | Tragic 14.0% |
| Chippewa | 0.0 /100 | #317 | Tragic 14.0% |
| Paiute | 0.0 /100 | #318 | Tragic 14.0% |
| Iroquois | 0.0 /100 | #319 | Tragic 14.0% |
| Americans | 0.0 /100 | #320 | Tragic 14.1% |
| Potawatomi | 0.0 /100 | #321 | Tragic 14.1% |
| Pueblo | 0.0 /100 | #322 | Tragic 14.1% |
| Blacks/African Americans | 0.0 /100 | #323 | Tragic 14.1% |
| Natives/Alaskans | 0.0 /100 | #324 | Tragic 14.1% |
| Navajo | 0.0 /100 | #325 | Tragic 14.2% |
| Comanche | 0.0 /100 | #326 | Tragic 14.2% |
| Ottawa | 0.0 /100 | #327 | Tragic 14.2% |
| Cape Verdeans | 0.0 /100 | #328 | Tragic 14.2% |
| Osage | 0.0 /100 | #329 | Tragic 14.3% |
| Yuman | 0.0 /100 | #330 | Tragic 14.5% |
Demographics Similar to Immigrants from Germany by Female Disability
In terms of female disability, the demographic groups most similar to Immigrants from Germany are British West Indian (12.7%, a difference of 0.070%), Hawaiian (12.7%, a difference of 0.080%), Liberian (12.7%, a difference of 0.10%), Aleut (12.7%, a difference of 0.10%), and Jamaican (12.7%, a difference of 0.11%).
| Demographics | Rating | Rank | Female Disability |
| Carpatho Rusyns | 2.0 /100 | #248 | Tragic 12.6% |
| Immigrants | Congo | 1.8 /100 | #249 | Tragic 12.7% |
| Slovenes | 1.7 /100 | #250 | Tragic 12.7% |
| Crow | 1.6 /100 | #251 | Tragic 12.7% |
| Immigrants | Caribbean | 1.4 /100 | #252 | Tragic 12.7% |
| Jamaicans | 1.4 /100 | #253 | Tragic 12.7% |
| Hawaiians | 1.4 /100 | #254 | Tragic 12.7% |
| Immigrants | Germany | 1.3 /100 | #255 | Tragic 12.7% |
| British West Indians | 1.2 /100 | #256 | Tragic 12.7% |
| Liberians | 1.1 /100 | #257 | Tragic 12.7% |
| Aleuts | 1.1 /100 | #258 | Tragic 12.7% |
| Immigrants | Armenia | 1.0 /100 | #259 | Tragic 12.7% |
| Sub-Saharan Africans | 1.0 /100 | #260 | Tragic 12.7% |
| Bermudans | 1.0 /100 | #261 | Tragic 12.7% |
| Czechoslovakians | 0.9 /100 | #262 | Tragic 12.7% |