Immigrants from Portugal vs Immigrants from Belize Female Disability
COMPARE
Immigrants from Portugal
Immigrants from Belize
Female Disability
Female Disability Comparison
Immigrants from Portugal
Immigrants from Belize
13.5%
FEMALE DISABILITY
0.0/ 100
METRIC RATING
303rd/ 347
METRIC RANK
12.5%
FEMALE DISABILITY
7.0/ 100
METRIC RATING
230th/ 347
METRIC RANK
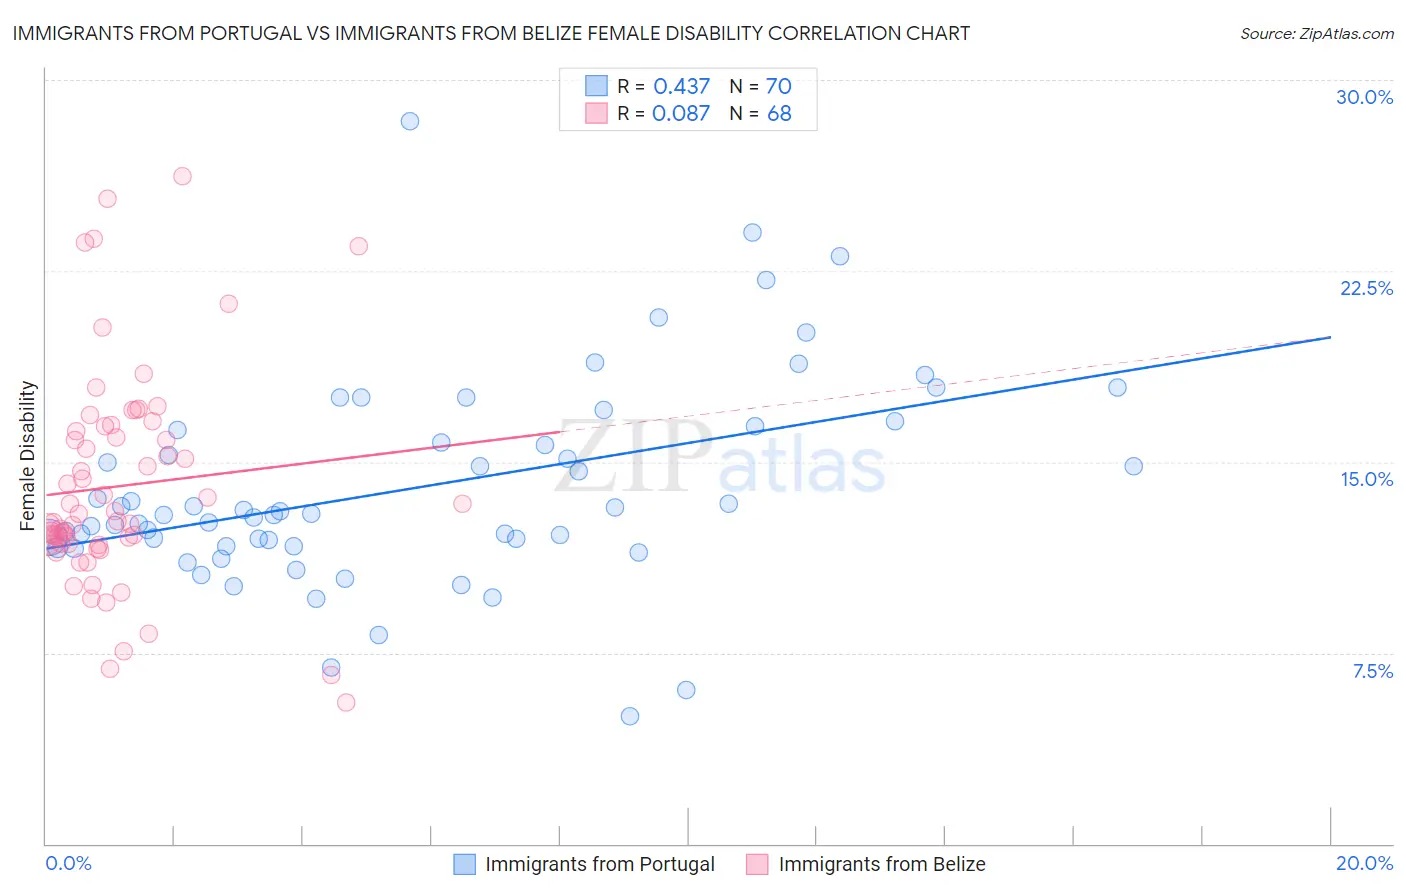
Immigrants from Portugal vs Immigrants from Belize Female Disability Correlation Chart
The statistical analysis conducted on geographies consisting of 174,785,293 people shows a moderate positive correlation between the proportion of Immigrants from Portugal and percentage of females with a disability in the United States with a correlation coefficient (R) of 0.437 and weighted average of 13.5%. Similarly, the statistical analysis conducted on geographies consisting of 130,293,394 people shows a slight positive correlation between the proportion of Immigrants from Belize and percentage of females with a disability in the United States with a correlation coefficient (R) of 0.087 and weighted average of 12.5%, a difference of 7.6%.
Female Disability Correlation Summary
| Measurement | Immigrants from Portugal | Immigrants from Belize |
| Minimum | 5.0% | 5.5% |
| Maximum | 28.4% | 26.2% |
| Range | 23.4% | 20.7% |
| Mean | 14.0% | 14.0% |
| Median | 12.9% | 12.8% |
| Interquartile 25% (IQ1) | 11.7% | 11.8% |
| Interquartile 75% (IQ3) | 16.3% | 16.3% |
| Interquartile Range (IQR) | 4.6% | 4.5% |
| Standard Deviation (Sample) | 4.1% | 4.3% |
| Standard Deviation (Population) | 4.0% | 4.2% |
Similar Demographics by Female Disability
Demographics Similar to Immigrants from Portugal by Female Disability
In terms of female disability, the demographic groups most similar to Immigrants from Portugal are Scotch-Irish (13.4%, a difference of 0.0%), Immigrants from Micronesia (13.5%, a difference of 0.030%), African (13.4%, a difference of 0.14%), Pennsylvania German (13.4%, a difference of 0.34%), and Dominican (13.5%, a difference of 0.34%).
| Demographics | Rating | Rank | Female Disability |
| Nepalese | 0.0 /100 | #296 | Tragic 13.3% |
| Slovaks | 0.0 /100 | #297 | Tragic 13.3% |
| Immigrants | Nonimmigrants | 0.0 /100 | #298 | Tragic 13.4% |
| Immigrants | Dominican Republic | 0.0 /100 | #299 | Tragic 13.4% |
| Pennsylvania Germans | 0.0 /100 | #300 | Tragic 13.4% |
| Africans | 0.0 /100 | #301 | Tragic 13.4% |
| Scotch-Irish | 0.0 /100 | #302 | Tragic 13.4% |
| Immigrants | Portugal | 0.0 /100 | #303 | Tragic 13.5% |
| Immigrants | Micronesia | 0.0 /100 | #304 | Tragic 13.5% |
| Dominicans | 0.0 /100 | #305 | Tragic 13.5% |
| French Canadians | 0.0 /100 | #306 | Tragic 13.6% |
| Central American Indians | 0.0 /100 | #307 | Tragic 13.6% |
| Cree | 0.0 /100 | #308 | Tragic 13.7% |
| French American Indians | 0.0 /100 | #309 | Tragic 13.7% |
| Apache | 0.0 /100 | #310 | Tragic 13.7% |
Demographics Similar to Immigrants from Belize by Female Disability
In terms of female disability, the demographic groups most similar to Immigrants from Belize are Hungarian (12.5%, a difference of 0.030%), Belgian (12.5%, a difference of 0.070%), Immigrants from Cambodia (12.5%, a difference of 0.11%), Assyrian/Chaldean/Syriac (12.5%, a difference of 0.13%), and Hispanic or Latino (12.5%, a difference of 0.14%).
| Demographics | Rating | Rank | Female Disability |
| Guamanians/Chamorros | 9.5 /100 | #223 | Tragic 12.5% |
| Belizeans | 9.3 /100 | #224 | Tragic 12.5% |
| Poles | 8.4 /100 | #225 | Tragic 12.5% |
| Hispanics or Latinos | 8.0 /100 | #226 | Tragic 12.5% |
| Assyrians/Chaldeans/Syriacs | 8.0 /100 | #227 | Tragic 12.5% |
| Immigrants | Cambodia | 7.8 /100 | #228 | Tragic 12.5% |
| Hungarians | 7.2 /100 | #229 | Tragic 12.5% |
| Immigrants | Belize | 7.0 /100 | #230 | Tragic 12.5% |
| Belgians | 6.5 /100 | #231 | Tragic 12.5% |
| Immigrants | Somalia | 5.9 /100 | #232 | Tragic 12.5% |
| Immigrants | Iraq | 5.3 /100 | #233 | Tragic 12.5% |
| Scandinavians | 5.3 /100 | #234 | Tragic 12.5% |
| Malaysians | 5.0 /100 | #235 | Tragic 12.5% |
| Immigrants | West Indies | 4.4 /100 | #236 | Tragic 12.6% |
| Slavs | 3.8 /100 | #237 | Tragic 12.6% |