Scotch-Irish vs Osage Unemployment Among Youth under 25 years
COMPARE
Scotch-Irish
Osage
Unemployment Among Youth under 25 years
Unemployment Among Youth under 25 years Comparison
Scotch-Irish
Osage
11.1%
UNEMPLOYMENT AMONG YOUTH UNDER 25 YEARS
98.8/ 100
METRIC RATING
58th/ 347
METRIC RANK
10.7%
UNEMPLOYMENT AMONG YOUTH UNDER 25 YEARS
99.9/ 100
METRIC RATING
30th/ 347
METRIC RANK
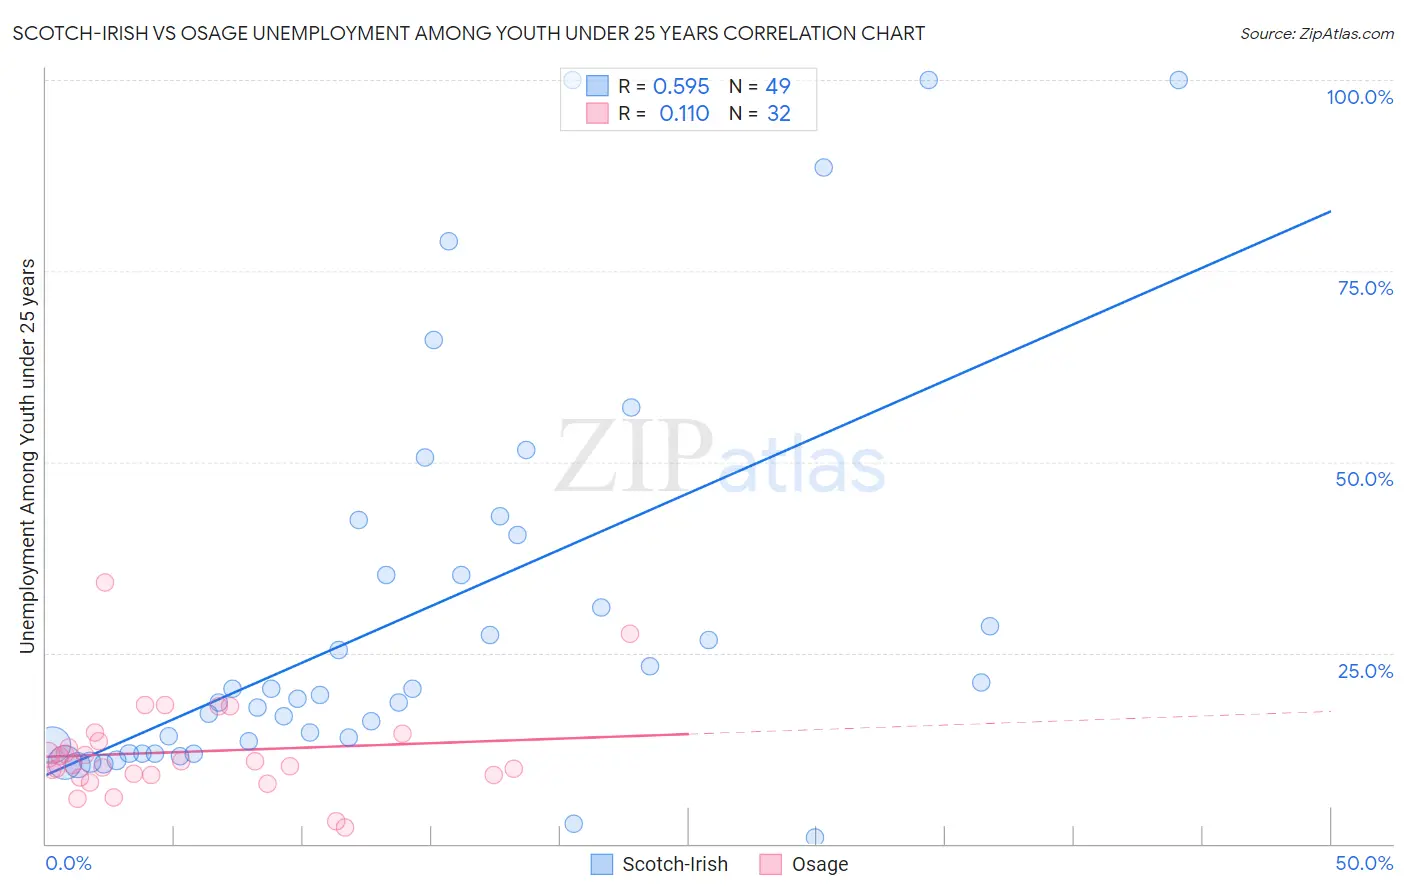
Scotch-Irish vs Osage Unemployment Among Youth under 25 years Correlation Chart
The statistical analysis conducted on geographies consisting of 527,464,403 people shows a substantial positive correlation between the proportion of Scotch-Irish and unemployment rate among youth under the age of 25 in the United States with a correlation coefficient (R) of 0.595 and weighted average of 11.1%. Similarly, the statistical analysis conducted on geographies consisting of 91,372,569 people shows a poor positive correlation between the proportion of Osage and unemployment rate among youth under the age of 25 in the United States with a correlation coefficient (R) of 0.110 and weighted average of 10.7%, a difference of 3.4%.
Unemployment Among Youth under 25 years Correlation Summary
| Measurement | Scotch-Irish | Osage |
| Minimum | 0.80% | 2.1% |
| Maximum | 100.0% | 34.2% |
| Range | 99.2% | 32.1% |
| Mean | 29.8% | 12.1% |
| Median | 19.4% | 10.5% |
| Interquartile 25% (IQ1) | 12.4% | 9.0% |
| Interquartile 75% (IQ3) | 37.9% | 13.9% |
| Interquartile Range (IQR) | 25.5% | 4.9% |
| Standard Deviation (Sample) | 25.8% | 6.3% |
| Standard Deviation (Population) | 25.6% | 6.2% |
Similar Demographics by Unemployment Among Youth under 25 years
Demographics Similar to Scotch-Irish by Unemployment Among Youth under 25 years
In terms of unemployment among youth under 25 years, the demographic groups most similar to Scotch-Irish are Immigrants from Eritrea (11.1%, a difference of 0.040%), Immigrants from Saudi Arabia (11.1%, a difference of 0.050%), Immigrants from Eastern Africa (11.1%, a difference of 0.060%), Mongolian (11.1%, a difference of 0.070%), and Irish (11.1%, a difference of 0.070%).
| Demographics | Rating | Rank | Unemployment Among Youth under 25 years |
| Serbians | 99.0 /100 | #51 | Exceptional 11.0% |
| Latvians | 99.0 /100 | #52 | Exceptional 11.0% |
| Ottawa | 99.0 /100 | #53 | Exceptional 11.1% |
| Mongolians | 98.9 /100 | #54 | Exceptional 11.1% |
| Irish | 98.9 /100 | #55 | Exceptional 11.1% |
| Immigrants | Saudi Arabia | 98.8 /100 | #56 | Exceptional 11.1% |
| Immigrants | Eritrea | 98.8 /100 | #57 | Exceptional 11.1% |
| Scotch-Irish | 98.8 /100 | #58 | Exceptional 11.1% |
| Immigrants | Eastern Africa | 98.7 /100 | #59 | Exceptional 11.1% |
| South Africans | 98.5 /100 | #60 | Exceptional 11.1% |
| Filipinos | 98.3 /100 | #61 | Exceptional 11.1% |
| Immigrants | Netherlands | 98.1 /100 | #62 | Exceptional 11.1% |
| Immigrants | Croatia | 98.1 /100 | #63 | Exceptional 11.1% |
| Jordanians | 97.9 /100 | #64 | Exceptional 11.1% |
| Immigrants | Singapore | 97.8 /100 | #65 | Exceptional 11.2% |
Demographics Similar to Osage by Unemployment Among Youth under 25 years
In terms of unemployment among youth under 25 years, the demographic groups most similar to Osage are Chinese (10.7%, a difference of 0.060%), Slovene (10.7%, a difference of 0.11%), Taiwanese (10.8%, a difference of 0.37%), Somali (10.7%, a difference of 0.41%), and Yugoslavian (10.7%, a difference of 0.45%).
| Demographics | Rating | Rank | Unemployment Among Youth under 25 years |
| Immigrants | Bosnia and Herzegovina | 100.0 /100 | #23 | Exceptional 10.6% |
| Finns | 100.0 /100 | #24 | Exceptional 10.7% |
| Immigrants | North Macedonia | 100.0 /100 | #25 | Exceptional 10.7% |
| Immigrants | India | 100.0 /100 | #26 | Exceptional 10.7% |
| Yugoslavians | 100.0 /100 | #27 | Exceptional 10.7% |
| Somalis | 100.0 /100 | #28 | Exceptional 10.7% |
| Chinese | 99.9 /100 | #29 | Exceptional 10.7% |
| Osage | 99.9 /100 | #30 | Exceptional 10.7% |
| Slovenes | 99.9 /100 | #31 | Exceptional 10.7% |
| Taiwanese | 99.9 /100 | #32 | Exceptional 10.8% |
| Europeans | 99.9 /100 | #33 | Exceptional 10.8% |
| English | 99.9 /100 | #34 | Exceptional 10.8% |
| Immigrants | Nepal | 99.9 /100 | #35 | Exceptional 10.8% |
| Hmong | 99.8 /100 | #36 | Exceptional 10.8% |
| Immigrants | Zimbabwe | 99.8 /100 | #37 | Exceptional 10.8% |