Immigrants from Ethiopia vs Hungarian Disability Age 65 to 74
COMPARE
Immigrants from Ethiopia
Hungarian
Disability Age 65 to 74
Disability Age 65 to 74 Comparison
Immigrants from Ethiopia
Hungarians
22.7%
DISABILITY AGE 65 TO 74
85.3/ 100
METRIC RATING
142nd/ 347
METRIC RANK
22.4%
DISABILITY AGE 65 TO 74
93.3/ 100
METRIC RATING
123rd/ 347
METRIC RANK
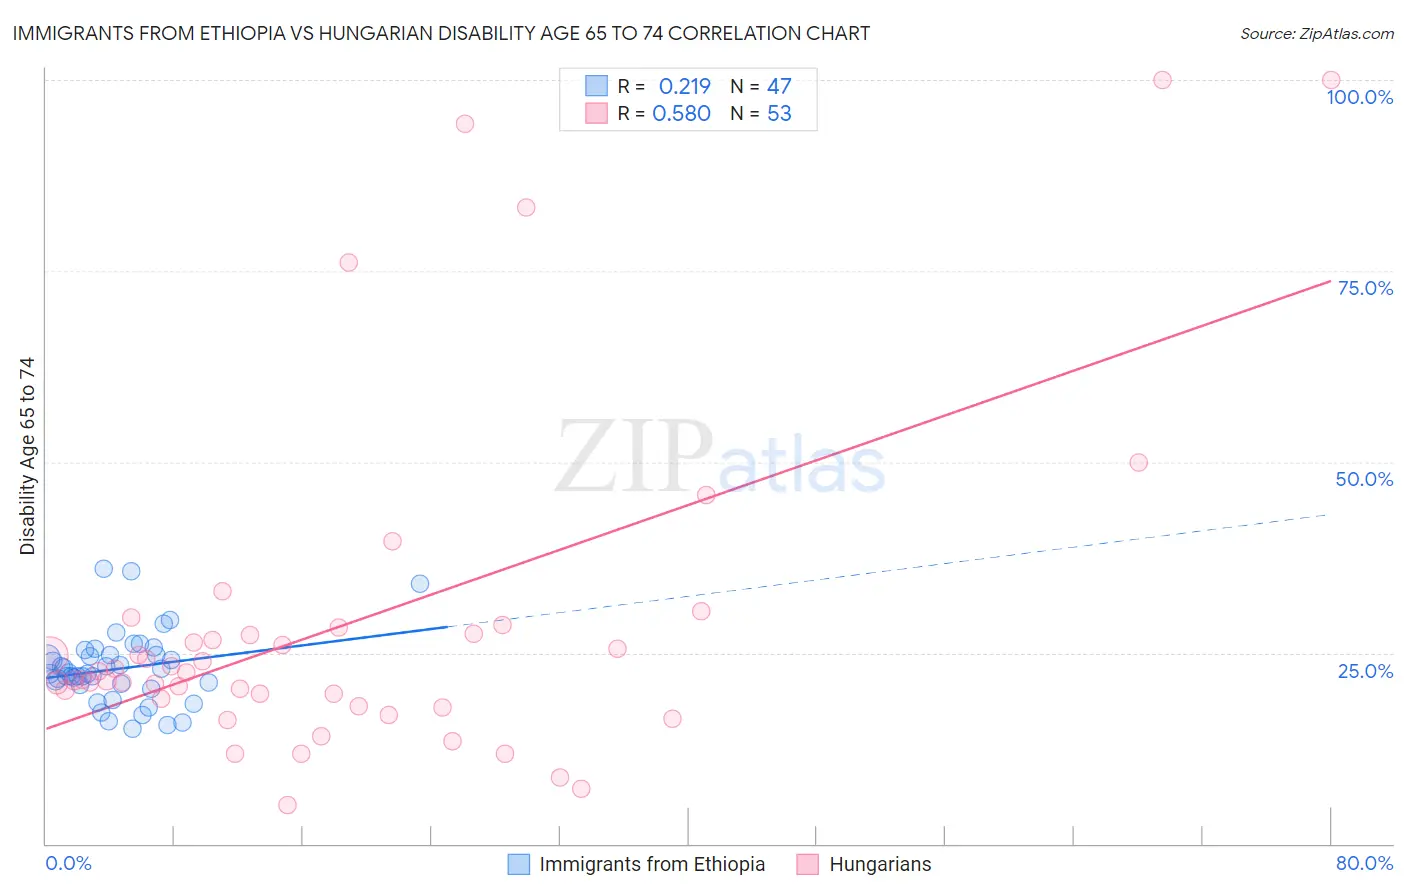
Immigrants from Ethiopia vs Hungarian Disability Age 65 to 74 Correlation Chart
The statistical analysis conducted on geographies consisting of 211,341,369 people shows a weak positive correlation between the proportion of Immigrants from Ethiopia and percentage of population with a disability between the ages 65 and 75 in the United States with a correlation coefficient (R) of 0.219 and weighted average of 22.7%. Similarly, the statistical analysis conducted on geographies consisting of 484,991,296 people shows a substantial positive correlation between the proportion of Hungarians and percentage of population with a disability between the ages 65 and 75 in the United States with a correlation coefficient (R) of 0.580 and weighted average of 22.4%, a difference of 1.3%.
Disability Age 65 to 74 Correlation Summary
| Measurement | Immigrants from Ethiopia | Hungarian |
| Minimum | 15.1% | 5.1% |
| Maximum | 35.9% | 100.0% |
| Range | 20.9% | 94.9% |
| Mean | 22.9% | 28.7% |
| Median | 22.3% | 22.4% |
| Interquartile 25% (IQ1) | 20.7% | 18.5% |
| Interquartile 75% (IQ3) | 24.7% | 27.9% |
| Interquartile Range (IQR) | 4.0% | 9.3% |
| Standard Deviation (Sample) | 4.7% | 22.0% |
| Standard Deviation (Population) | 4.6% | 21.8% |
Demographics Similar to Immigrants from Ethiopia and Hungarians by Disability Age 65 to 74
In terms of disability age 65 to 74, the demographic groups most similar to Immigrants from Ethiopia are Belgian (22.7%, a difference of 0.010%), Ugandan (22.7%, a difference of 0.020%), Immigrants from Syria (22.7%, a difference of 0.060%), Immigrants from Moldova (22.7%, a difference of 0.25%), and Taiwanese (22.7%, a difference of 0.30%). Similarly, the demographic groups most similar to Hungarians are Immigrants from Jordan (22.4%, a difference of 0.050%), Norwegian (22.5%, a difference of 0.19%), Immigrants from Western Europe (22.5%, a difference of 0.23%), Lebanese (22.5%, a difference of 0.25%), and Slovak (22.5%, a difference of 0.36%).
| Demographics | Rating | Rank | Disability Age 65 to 74 |
| Immigrants | Jordan | 93.5 /100 | #122 | Exceptional 22.4% |
| Hungarians | 93.3 /100 | #123 | Exceptional 22.4% |
| Norwegians | 92.5 /100 | #124 | Exceptional 22.5% |
| Immigrants | Western Europe | 92.3 /100 | #125 | Exceptional 22.5% |
| Lebanese | 92.2 /100 | #126 | Exceptional 22.5% |
| Slovaks | 91.6 /100 | #127 | Exceptional 22.5% |
| Immigrants | Costa Rica | 90.4 /100 | #128 | Exceptional 22.6% |
| Immigrants | Uruguay | 90.1 /100 | #129 | Exceptional 22.6% |
| Immigrants | Albania | 90.0 /100 | #130 | Excellent 22.6% |
| Immigrants | Nepal | 89.4 /100 | #131 | Excellent 22.6% |
| Costa Ricans | 89.2 /100 | #132 | Excellent 22.6% |
| Northern Europeans | 88.9 /100 | #133 | Excellent 22.6% |
| Afghans | 88.6 /100 | #134 | Excellent 22.6% |
| Immigrants | Ukraine | 88.4 /100 | #135 | Excellent 22.6% |
| Ethiopians | 87.9 /100 | #136 | Excellent 22.7% |
| Taiwanese | 87.6 /100 | #137 | Excellent 22.7% |
| Immigrants | Moldova | 87.3 /100 | #138 | Excellent 22.7% |
| Immigrants | Syria | 85.8 /100 | #139 | Excellent 22.7% |
| Ugandans | 85.4 /100 | #140 | Excellent 22.7% |
| Belgians | 85.3 /100 | #141 | Excellent 22.7% |
| Immigrants | Ethiopia | 85.3 /100 | #142 | Excellent 22.7% |