Scotch-Irish vs Greek College, Under 1 year
COMPARE
Scotch-Irish
Greek
College, Under 1 year
College, Under 1 year Comparison
Scotch-Irish
Greeks
65.4%
COLLEGE, UNDER 1 YEAR
49.5/ 100
METRIC RATING
175th/ 347
METRIC RANK
68.5%
COLLEGE, UNDER 1 YEAR
98.6/ 100
METRIC RATING
79th/ 347
METRIC RANK
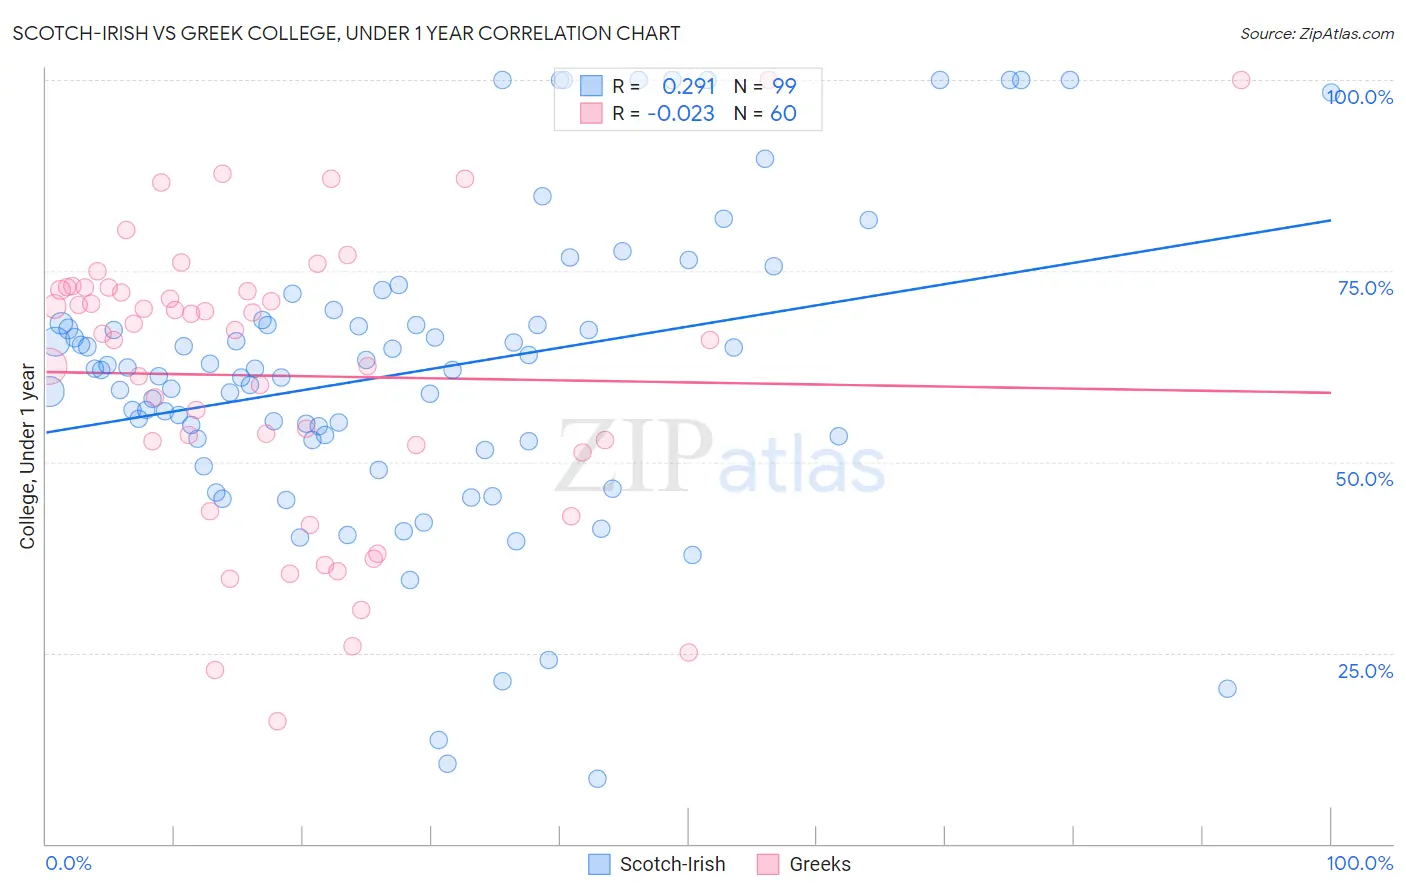
Scotch-Irish vs Greek College, Under 1 year Correlation Chart
The statistical analysis conducted on geographies consisting of 548,775,844 people shows a weak positive correlation between the proportion of Scotch-Irish and percentage of population with at least college, under 1 year education in the United States with a correlation coefficient (R) of 0.291 and weighted average of 65.4%. Similarly, the statistical analysis conducted on geographies consisting of 482,772,092 people shows no correlation between the proportion of Greeks and percentage of population with at least college, under 1 year education in the United States with a correlation coefficient (R) of -0.023 and weighted average of 68.5%, a difference of 4.7%.
College, Under 1 year Correlation Summary
| Measurement | Scotch-Irish | Greek |
| Minimum | 8.6% | 16.1% |
| Maximum | 100.0% | 100.0% |
| Range | 91.4% | 83.9% |
| Mean | 61.8% | 61.3% |
| Median | 62.1% | 67.1% |
| Interquartile 25% (IQ1) | 52.8% | 51.7% |
| Interquartile 75% (IQ3) | 68.1% | 72.6% |
| Interquartile Range (IQR) | 15.3% | 21.0% |
| Standard Deviation (Sample) | 20.0% | 18.9% |
| Standard Deviation (Population) | 19.9% | 18.8% |
Similar Demographics by College, Under 1 year
Demographics Similar to Scotch-Irish by College, Under 1 year
In terms of college, under 1 year, the demographic groups most similar to Scotch-Irish are Immigrants from Bosnia and Herzegovina (65.4%, a difference of 0.020%), French (65.4%, a difference of 0.030%), Immigrants from North Macedonia (65.4%, a difference of 0.040%), German Russian (65.4%, a difference of 0.050%), and Guamanian/Chamorro (65.4%, a difference of 0.060%).
| Demographics | Rating | Rank | College, Under 1 year |
| Hungarians | 55.9 /100 | #168 | Average 65.6% |
| Yugoslavians | 55.7 /100 | #169 | Average 65.6% |
| Germans | 55.7 /100 | #170 | Average 65.6% |
| Immigrants | Oceania | 55.0 /100 | #171 | Average 65.6% |
| South American Indians | 54.4 /100 | #172 | Average 65.5% |
| Swiss | 53.9 /100 | #173 | Average 65.5% |
| Immigrants | Bosnia and Herzegovina | 50.0 /100 | #174 | Average 65.4% |
| Scotch-Irish | 49.5 /100 | #175 | Average 65.4% |
| French | 48.9 /100 | #176 | Average 65.4% |
| Immigrants | North Macedonia | 48.6 /100 | #177 | Average 65.4% |
| German Russians | 48.3 /100 | #178 | Average 65.4% |
| Guamanians/Chamorros | 48.2 /100 | #179 | Average 65.4% |
| Dutch | 46.1 /100 | #180 | Average 65.3% |
| Spaniards | 45.5 /100 | #181 | Average 65.3% |
| Immigrants | Africa | 44.7 /100 | #182 | Average 65.3% |
Demographics Similar to Greeks by College, Under 1 year
In terms of college, under 1 year, the demographic groups most similar to Greeks are Danish (68.5%, a difference of 0.010%), British (68.5%, a difference of 0.020%), Immigrants from Spain (68.4%, a difference of 0.030%), Immigrants from Western Europe (68.5%, a difference of 0.070%), and Laotian (68.5%, a difference of 0.070%).
| Demographics | Rating | Rank | College, Under 1 year |
| Bolivians | 99.0 /100 | #72 | Exceptional 68.7% |
| Immigrants | England | 99.0 /100 | #73 | Exceptional 68.7% |
| Swedes | 98.9 /100 | #74 | Exceptional 68.7% |
| Immigrants | Western Europe | 98.6 /100 | #75 | Exceptional 68.5% |
| Laotians | 98.6 /100 | #76 | Exceptional 68.5% |
| British | 98.6 /100 | #77 | Exceptional 68.5% |
| Danes | 98.6 /100 | #78 | Exceptional 68.5% |
| Greeks | 98.6 /100 | #79 | Exceptional 68.5% |
| Immigrants | Spain | 98.5 /100 | #80 | Exceptional 68.4% |
| Immigrants | Greece | 98.5 /100 | #81 | Exceptional 68.4% |
| Norwegians | 98.4 /100 | #82 | Exceptional 68.4% |
| Argentineans | 98.4 /100 | #83 | Exceptional 68.4% |
| Immigrants | Hungary | 98.3 /100 | #84 | Exceptional 68.3% |
| Egyptians | 98.3 /100 | #85 | Exceptional 68.3% |
| Immigrants | Lebanon | 98.3 /100 | #86 | Exceptional 68.3% |