Scandinavian vs Immigrants from Argentina Ambulatory Disability
COMPARE
Scandinavian
Immigrants from Argentina
Ambulatory Disability
Ambulatory Disability Comparison
Scandinavians
Immigrants from Argentina
6.1%
AMBULATORY DISABILITY
44.5/ 100
METRIC RATING
178th/ 347
METRIC RANK
5.6%
AMBULATORY DISABILITY
99.9/ 100
METRIC RATING
48th/ 347
METRIC RANK
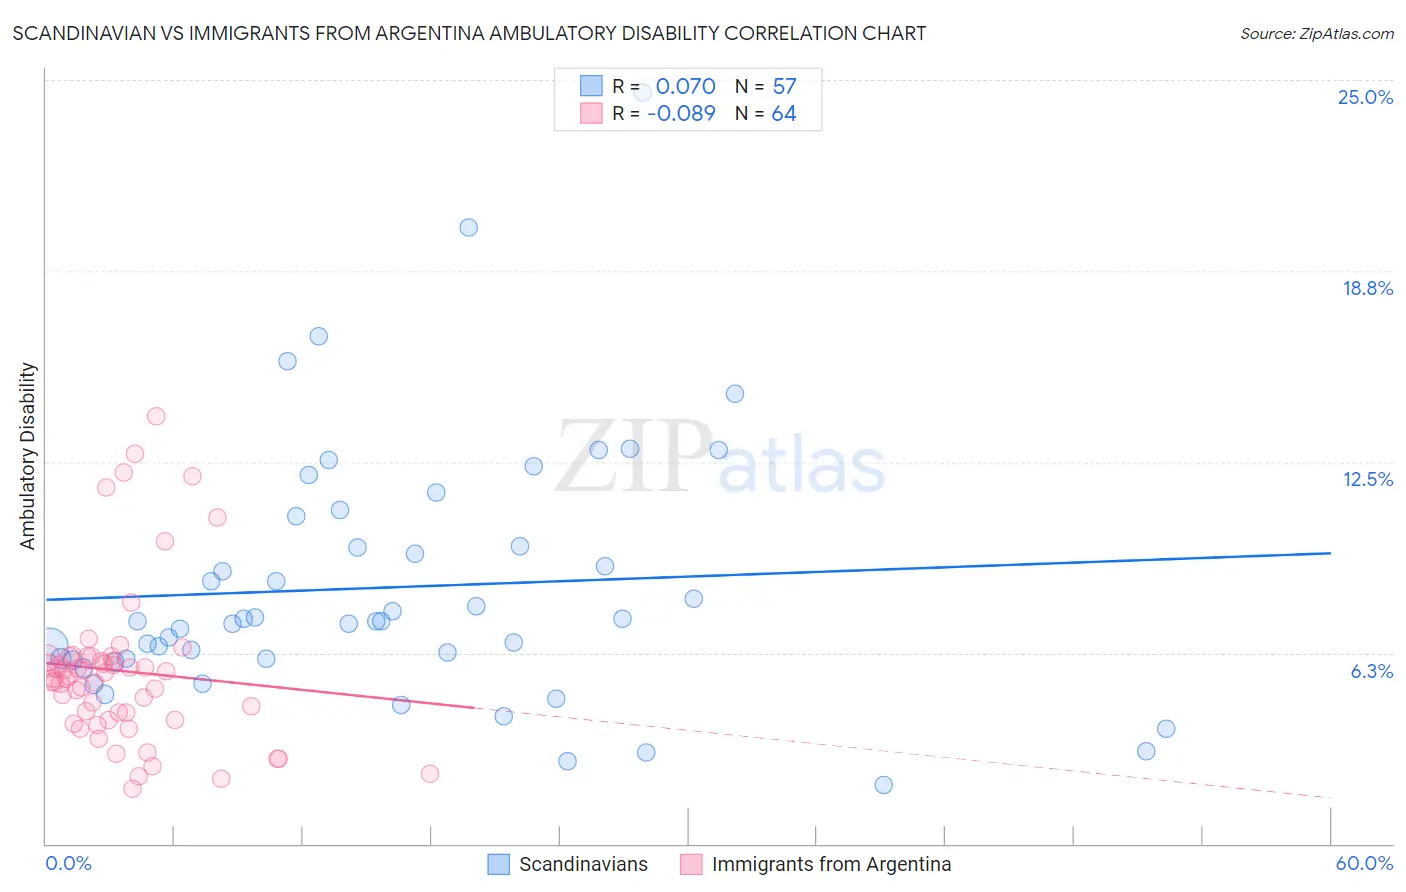
Scandinavian vs Immigrants from Argentina Ambulatory Disability Correlation Chart
The statistical analysis conducted on geographies consisting of 472,401,593 people shows a slight positive correlation between the proportion of Scandinavians and percentage of population with ambulatory disability in the United States with a correlation coefficient (R) of 0.070 and weighted average of 6.1%. Similarly, the statistical analysis conducted on geographies consisting of 264,391,050 people shows a slight negative correlation between the proportion of Immigrants from Argentina and percentage of population with ambulatory disability in the United States with a correlation coefficient (R) of -0.089 and weighted average of 5.6%, a difference of 10.4%.
Ambulatory Disability Correlation Summary
| Measurement | Scandinavian | Immigrants from Argentina |
| Minimum | 1.9% | 1.8% |
| Maximum | 24.6% | 14.0% |
| Range | 22.7% | 12.2% |
| Mean | 8.4% | 5.7% |
| Median | 7.3% | 5.4% |
| Interquartile 25% (IQ1) | 6.0% | 4.2% |
| Interquartile 75% (IQ3) | 10.2% | 6.1% |
| Interquartile Range (IQR) | 4.2% | 1.9% |
| Standard Deviation (Sample) | 4.2% | 2.6% |
| Standard Deviation (Population) | 4.2% | 2.6% |
Similar Demographics by Ambulatory Disability
Demographics Similar to Scandinavians by Ambulatory Disability
In terms of ambulatory disability, the demographic groups most similar to Scandinavians are Austrian (6.1%, a difference of 0.020%), Immigrants from Nicaragua (6.1%, a difference of 0.030%), Immigrants from England (6.1%, a difference of 0.050%), Immigrants from North America (6.1%, a difference of 0.060%), and Swiss (6.1%, a difference of 0.080%).
| Demographics | Rating | Rank | Ambulatory Disability |
| Moroccans | 52.6 /100 | #171 | Average 6.1% |
| Immigrants | Burma/Myanmar | 52.2 /100 | #172 | Average 6.1% |
| Croatians | 51.2 /100 | #173 | Average 6.1% |
| Immigrants | Canada | 50.0 /100 | #174 | Average 6.1% |
| Vietnamese | 47.2 /100 | #175 | Average 6.1% |
| Immigrants | North America | 45.6 /100 | #176 | Average 6.1% |
| Immigrants | England | 45.4 /100 | #177 | Average 6.1% |
| Scandinavians | 44.5 /100 | #178 | Average 6.1% |
| Austrians | 44.1 /100 | #179 | Average 6.1% |
| Immigrants | Nicaragua | 43.9 /100 | #180 | Average 6.1% |
| Swiss | 43.1 /100 | #181 | Average 6.1% |
| Serbians | 42.8 /100 | #182 | Average 6.1% |
| Immigrants | Thailand | 42.2 /100 | #183 | Average 6.1% |
| Immigrants | Ghana | 41.2 /100 | #184 | Average 6.1% |
| Immigrants | Bosnia and Herzegovina | 37.2 /100 | #185 | Fair 6.2% |
Demographics Similar to Immigrants from Argentina by Ambulatory Disability
In terms of ambulatory disability, the demographic groups most similar to Immigrants from Argentina are Immigrants from Japan (5.6%, a difference of 0.010%), Immigrants from Sweden (5.6%, a difference of 0.020%), Egyptian (5.6%, a difference of 0.020%), Immigrants from Indonesia (5.5%, a difference of 0.19%), and Bulgarian (5.6%, a difference of 0.19%).
| Demographics | Rating | Rank | Ambulatory Disability |
| Mongolians | 99.9 /100 | #41 | Exceptional 5.5% |
| Argentineans | 99.9 /100 | #42 | Exceptional 5.5% |
| Paraguayans | 99.9 /100 | #43 | Exceptional 5.5% |
| Immigrants | Indonesia | 99.9 /100 | #44 | Exceptional 5.5% |
| Immigrants | Sweden | 99.9 /100 | #45 | Exceptional 5.6% |
| Egyptians | 99.9 /100 | #46 | Exceptional 5.6% |
| Immigrants | Japan | 99.9 /100 | #47 | Exceptional 5.6% |
| Immigrants | Argentina | 99.9 /100 | #48 | Exceptional 5.6% |
| Bulgarians | 99.9 /100 | #49 | Exceptional 5.6% |
| Luxembourgers | 99.9 /100 | #50 | Exceptional 5.6% |
| Taiwanese | 99.8 /100 | #51 | Exceptional 5.6% |
| Jordanians | 99.8 /100 | #52 | Exceptional 5.6% |
| Immigrants | Egypt | 99.8 /100 | #53 | Exceptional 5.6% |
| Immigrants | Eastern Africa | 99.8 /100 | #54 | Exceptional 5.6% |
| Immigrants | Bulgaria | 99.8 /100 | #55 | Exceptional 5.6% |