Scandinavian vs Immigrants from France Ambulatory Disability
COMPARE
Scandinavian
Immigrants from France
Ambulatory Disability
Ambulatory Disability Comparison
Scandinavians
Immigrants from France
6.1%
AMBULATORY DISABILITY
44.5/ 100
METRIC RATING
178th/ 347
METRIC RANK
5.6%
AMBULATORY DISABILITY
99.7/ 100
METRIC RATING
63rd/ 347
METRIC RANK
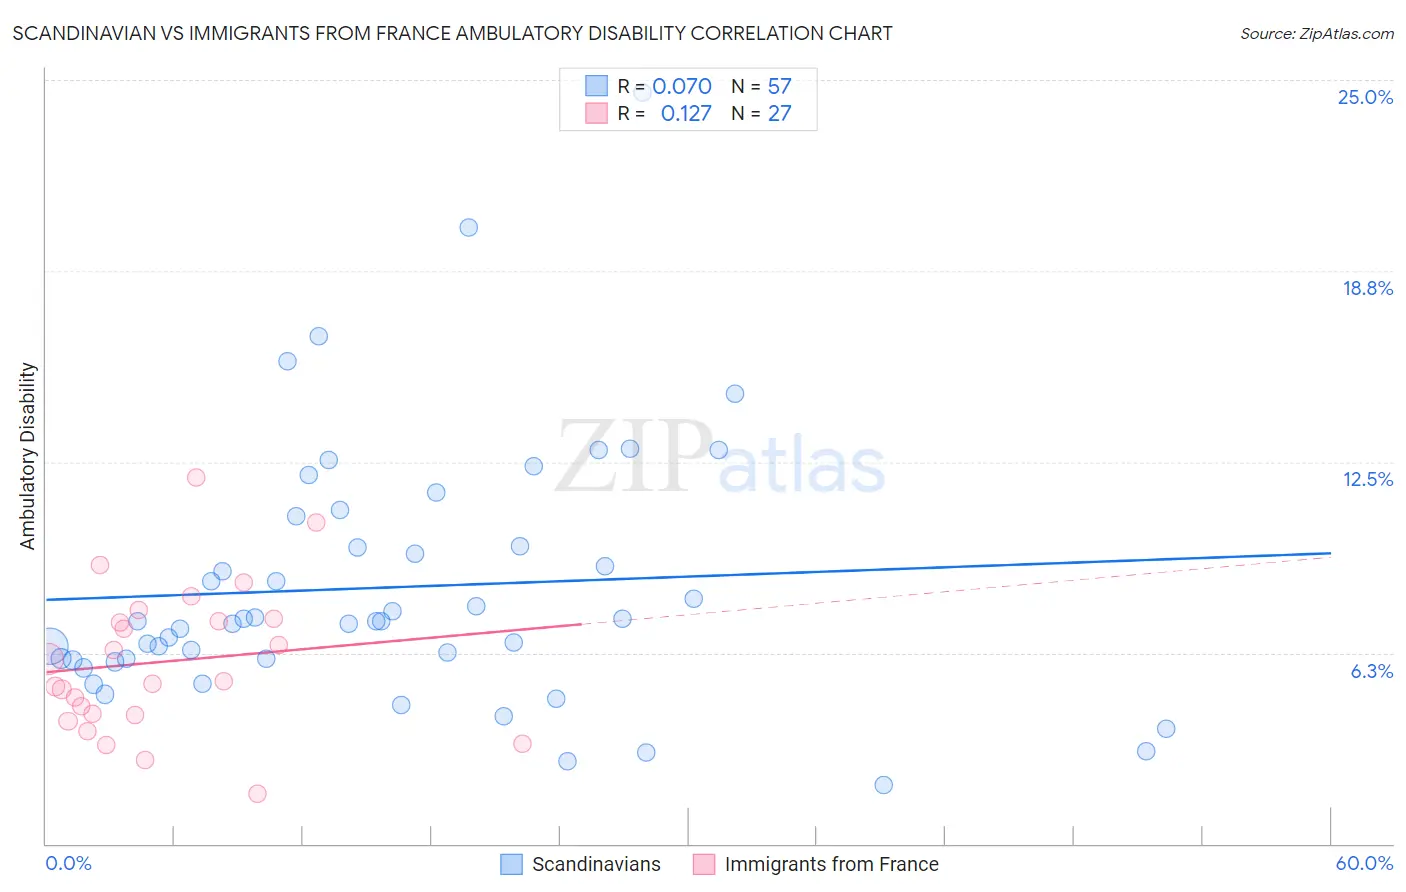
Scandinavian vs Immigrants from France Ambulatory Disability Correlation Chart
The statistical analysis conducted on geographies consisting of 472,401,593 people shows a slight positive correlation between the proportion of Scandinavians and percentage of population with ambulatory disability in the United States with a correlation coefficient (R) of 0.070 and weighted average of 6.1%. Similarly, the statistical analysis conducted on geographies consisting of 287,866,791 people shows a poor positive correlation between the proportion of Immigrants from France and percentage of population with ambulatory disability in the United States with a correlation coefficient (R) of 0.127 and weighted average of 5.6%, a difference of 8.7%.
Ambulatory Disability Correlation Summary
| Measurement | Scandinavian | Immigrants from France |
| Minimum | 1.9% | 1.6% |
| Maximum | 24.6% | 12.0% |
| Range | 22.7% | 10.4% |
| Mean | 8.4% | 6.0% |
| Median | 7.3% | 5.3% |
| Interquartile 25% (IQ1) | 6.0% | 4.2% |
| Interquartile 75% (IQ3) | 10.2% | 7.4% |
| Interquartile Range (IQR) | 4.2% | 3.2% |
| Standard Deviation (Sample) | 4.2% | 2.4% |
| Standard Deviation (Population) | 4.2% | 2.4% |
Similar Demographics by Ambulatory Disability
Demographics Similar to Scandinavians by Ambulatory Disability
In terms of ambulatory disability, the demographic groups most similar to Scandinavians are Austrian (6.1%, a difference of 0.020%), Immigrants from Nicaragua (6.1%, a difference of 0.030%), Immigrants from England (6.1%, a difference of 0.050%), Immigrants from North America (6.1%, a difference of 0.060%), and Swiss (6.1%, a difference of 0.080%).
| Demographics | Rating | Rank | Ambulatory Disability |
| Moroccans | 52.6 /100 | #171 | Average 6.1% |
| Immigrants | Burma/Myanmar | 52.2 /100 | #172 | Average 6.1% |
| Croatians | 51.2 /100 | #173 | Average 6.1% |
| Immigrants | Canada | 50.0 /100 | #174 | Average 6.1% |
| Vietnamese | 47.2 /100 | #175 | Average 6.1% |
| Immigrants | North America | 45.6 /100 | #176 | Average 6.1% |
| Immigrants | England | 45.4 /100 | #177 | Average 6.1% |
| Scandinavians | 44.5 /100 | #178 | Average 6.1% |
| Austrians | 44.1 /100 | #179 | Average 6.1% |
| Immigrants | Nicaragua | 43.9 /100 | #180 | Average 6.1% |
| Swiss | 43.1 /100 | #181 | Average 6.1% |
| Serbians | 42.8 /100 | #182 | Average 6.1% |
| Immigrants | Thailand | 42.2 /100 | #183 | Average 6.1% |
| Immigrants | Ghana | 41.2 /100 | #184 | Average 6.1% |
| Immigrants | Bosnia and Herzegovina | 37.2 /100 | #185 | Fair 6.2% |
Demographics Similar to Immigrants from France by Ambulatory Disability
In terms of ambulatory disability, the demographic groups most similar to Immigrants from France are Immigrants from Spain (5.6%, a difference of 0.12%), Immigrants from Belgium (5.6%, a difference of 0.13%), Laotian (5.7%, a difference of 0.13%), Immigrants from Switzerland (5.7%, a difference of 0.16%), and Israeli (5.7%, a difference of 0.25%).
| Demographics | Rating | Rank | Ambulatory Disability |
| Inupiat | 99.8 /100 | #56 | Exceptional 5.6% |
| Immigrants | Brazil | 99.8 /100 | #57 | Exceptional 5.6% |
| Immigrants | Zimbabwe | 99.8 /100 | #58 | Exceptional 5.6% |
| Immigrants | Afghanistan | 99.8 /100 | #59 | Exceptional 5.6% |
| Immigrants | Lithuania | 99.8 /100 | #60 | Exceptional 5.6% |
| Immigrants | Belgium | 99.7 /100 | #61 | Exceptional 5.6% |
| Immigrants | Spain | 99.7 /100 | #62 | Exceptional 5.6% |
| Immigrants | France | 99.7 /100 | #63 | Exceptional 5.6% |
| Laotians | 99.7 /100 | #64 | Exceptional 5.7% |
| Immigrants | Switzerland | 99.7 /100 | #65 | Exceptional 5.7% |
| Israelis | 99.6 /100 | #66 | Exceptional 5.7% |
| Immigrants | Uganda | 99.6 /100 | #67 | Exceptional 5.7% |
| Sri Lankans | 99.6 /100 | #68 | Exceptional 5.7% |
| Peruvians | 99.5 /100 | #69 | Exceptional 5.7% |
| Sierra Leoneans | 99.4 /100 | #70 | Exceptional 5.7% |