Scandinavian vs French American Indian Ambulatory Disability
COMPARE
Scandinavian
French American Indian
Ambulatory Disability
Ambulatory Disability Comparison
Scandinavians
French American Indians
6.1%
AMBULATORY DISABILITY
44.5/ 100
METRIC RATING
178th/ 347
METRIC RANK
6.9%
AMBULATORY DISABILITY
0.0/ 100
METRIC RATING
297th/ 347
METRIC RANK
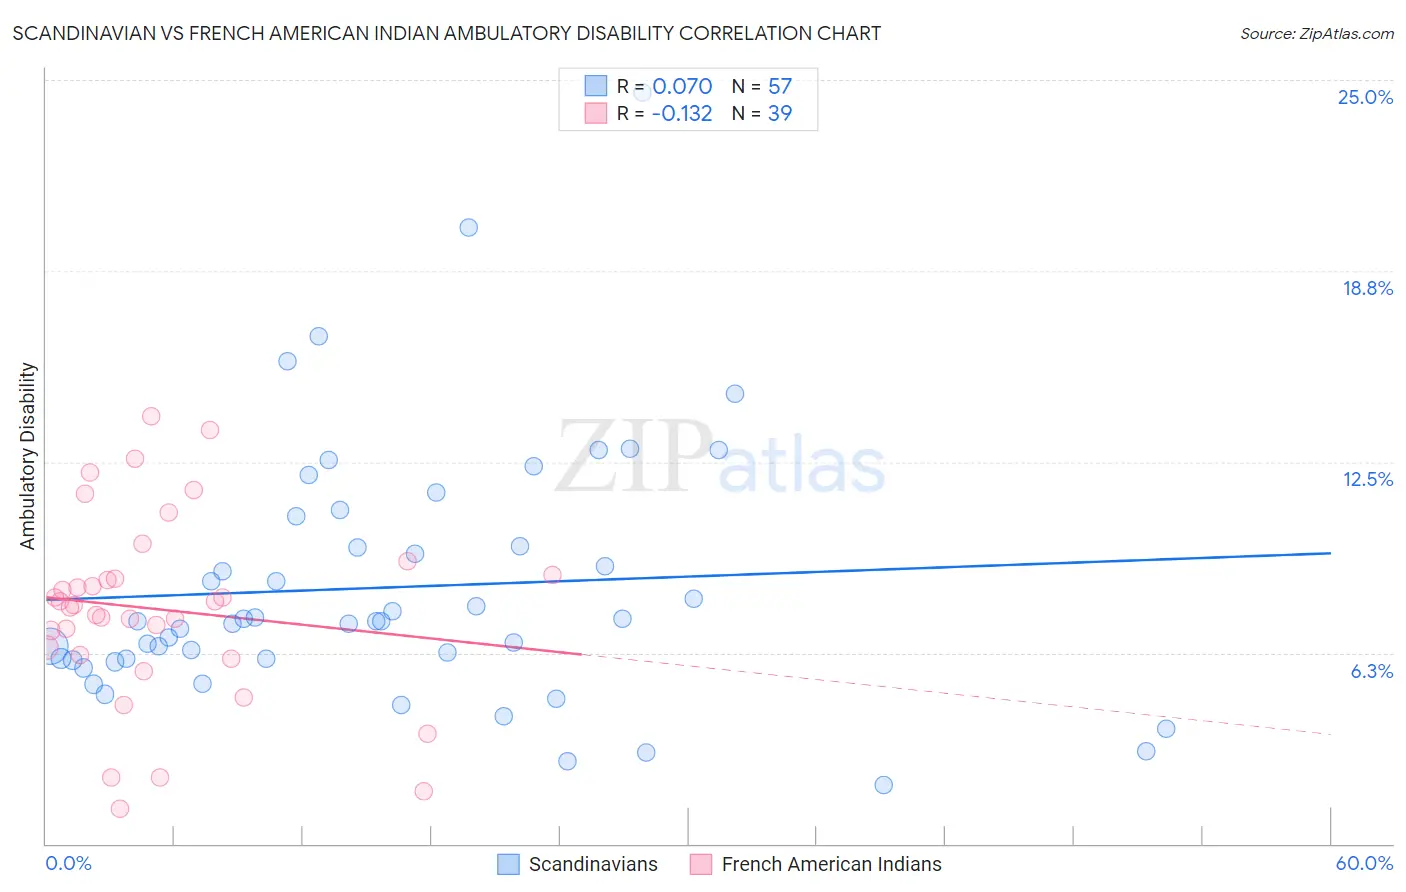
Scandinavian vs French American Indian Ambulatory Disability Correlation Chart
The statistical analysis conducted on geographies consisting of 472,401,593 people shows a slight positive correlation between the proportion of Scandinavians and percentage of population with ambulatory disability in the United States with a correlation coefficient (R) of 0.070 and weighted average of 6.1%. Similarly, the statistical analysis conducted on geographies consisting of 131,970,739 people shows a poor negative correlation between the proportion of French American Indians and percentage of population with ambulatory disability in the United States with a correlation coefficient (R) of -0.132 and weighted average of 6.9%, a difference of 13.0%.
Ambulatory Disability Correlation Summary
| Measurement | Scandinavian | French American Indian |
| Minimum | 1.9% | 1.2% |
| Maximum | 24.6% | 14.0% |
| Range | 22.7% | 12.8% |
| Mean | 8.4% | 7.7% |
| Median | 7.3% | 7.8% |
| Interquartile 25% (IQ1) | 6.0% | 6.2% |
| Interquartile 75% (IQ3) | 10.2% | 8.8% |
| Interquartile Range (IQR) | 4.2% | 2.6% |
| Standard Deviation (Sample) | 4.2% | 3.1% |
| Standard Deviation (Population) | 4.2% | 3.0% |
Similar Demographics by Ambulatory Disability
Demographics Similar to Scandinavians by Ambulatory Disability
In terms of ambulatory disability, the demographic groups most similar to Scandinavians are Austrian (6.1%, a difference of 0.020%), Immigrants from Nicaragua (6.1%, a difference of 0.030%), Immigrants from England (6.1%, a difference of 0.050%), Immigrants from North America (6.1%, a difference of 0.060%), and Swiss (6.1%, a difference of 0.080%).
| Demographics | Rating | Rank | Ambulatory Disability |
| Moroccans | 52.6 /100 | #171 | Average 6.1% |
| Immigrants | Burma/Myanmar | 52.2 /100 | #172 | Average 6.1% |
| Croatians | 51.2 /100 | #173 | Average 6.1% |
| Immigrants | Canada | 50.0 /100 | #174 | Average 6.1% |
| Vietnamese | 47.2 /100 | #175 | Average 6.1% |
| Immigrants | North America | 45.6 /100 | #176 | Average 6.1% |
| Immigrants | England | 45.4 /100 | #177 | Average 6.1% |
| Scandinavians | 44.5 /100 | #178 | Average 6.1% |
| Austrians | 44.1 /100 | #179 | Average 6.1% |
| Immigrants | Nicaragua | 43.9 /100 | #180 | Average 6.1% |
| Swiss | 43.1 /100 | #181 | Average 6.1% |
| Serbians | 42.8 /100 | #182 | Average 6.1% |
| Immigrants | Thailand | 42.2 /100 | #183 | Average 6.1% |
| Immigrants | Ghana | 41.2 /100 | #184 | Average 6.1% |
| Immigrants | Bosnia and Herzegovina | 37.2 /100 | #185 | Fair 6.2% |
Demographics Similar to French American Indians by Ambulatory Disability
In terms of ambulatory disability, the demographic groups most similar to French American Indians are Immigrants from Grenada (6.9%, a difference of 0.010%), Puget Sound Salish (6.9%, a difference of 0.14%), Marshallese (6.9%, a difference of 0.15%), Alaskan Athabascan (6.9%, a difference of 0.17%), and British West Indian (7.0%, a difference of 0.38%).
| Demographics | Rating | Rank | Ambulatory Disability |
| Scotch-Irish | 0.0 /100 | #290 | Tragic 6.9% |
| West Indians | 0.0 /100 | #291 | Tragic 6.9% |
| Cheyenne | 0.0 /100 | #292 | Tragic 6.9% |
| Immigrants | St. Vincent and the Grenadines | 0.0 /100 | #293 | Tragic 6.9% |
| Cape Verdeans | 0.0 /100 | #294 | Tragic 6.9% |
| Crow | 0.0 /100 | #295 | Tragic 6.9% |
| Alaskan Athabascans | 0.0 /100 | #296 | Tragic 6.9% |
| French American Indians | 0.0 /100 | #297 | Tragic 6.9% |
| Immigrants | Grenada | 0.0 /100 | #298 | Tragic 6.9% |
| Puget Sound Salish | 0.0 /100 | #299 | Tragic 6.9% |
| Marshallese | 0.0 /100 | #300 | Tragic 6.9% |
| British West Indians | 0.0 /100 | #301 | Tragic 7.0% |
| Immigrants | Armenia | 0.0 /100 | #302 | Tragic 7.0% |
| Africans | 0.0 /100 | #303 | Tragic 7.0% |
| Immigrants | Cabo Verde | 0.0 /100 | #304 | Tragic 7.0% |