Potawatomi vs Trinidadian and Tobagonian Ambulatory Disability
COMPARE
Potawatomi
Trinidadian and Tobagonian
Ambulatory Disability
Ambulatory Disability Comparison
Potawatomi
Trinidadians and Tobagonians
7.3%
AMBULATORY DISABILITY
0.0/ 100
METRIC RATING
320th/ 347
METRIC RANK
6.6%
AMBULATORY DISABILITY
0.2/ 100
METRIC RATING
267th/ 347
METRIC RANK
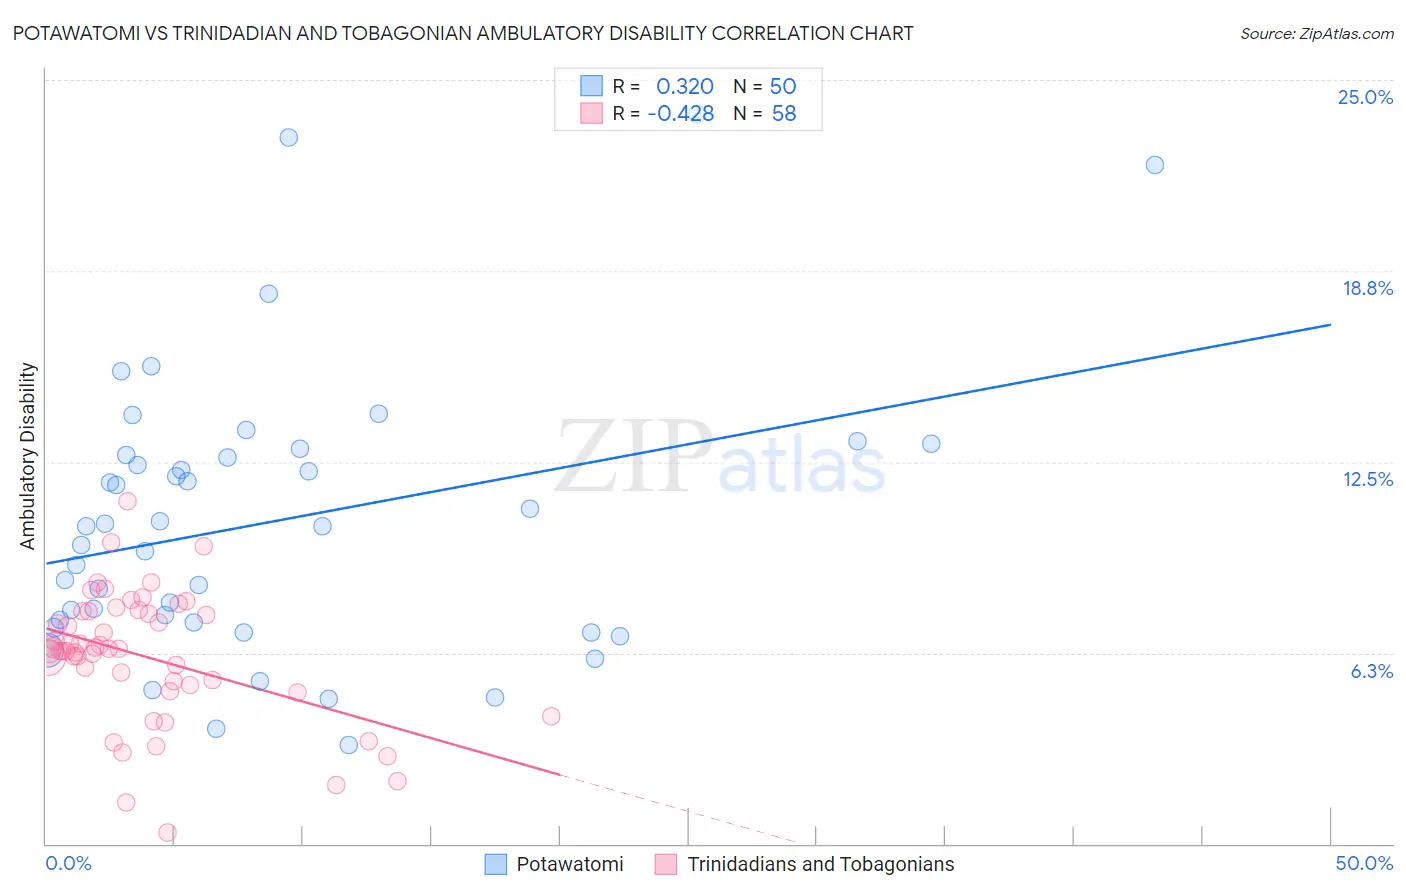
Potawatomi vs Trinidadian and Tobagonian Ambulatory Disability Correlation Chart
The statistical analysis conducted on geographies consisting of 117,764,729 people shows a mild positive correlation between the proportion of Potawatomi and percentage of population with ambulatory disability in the United States with a correlation coefficient (R) of 0.320 and weighted average of 7.3%. Similarly, the statistical analysis conducted on geographies consisting of 219,787,552 people shows a moderate negative correlation between the proportion of Trinidadians and Tobagonians and percentage of population with ambulatory disability in the United States with a correlation coefficient (R) of -0.428 and weighted average of 6.6%, a difference of 10.4%.
Ambulatory Disability Correlation Summary
| Measurement | Potawatomi | Trinidadian and Tobagonian |
| Minimum | 3.3% | 0.38% |
| Maximum | 23.9% | 11.2% |
| Range | 20.7% | 10.8% |
| Mean | 10.6% | 6.1% |
| Median | 10.4% | 6.3% |
| Interquartile 25% (IQ1) | 7.2% | 5.2% |
| Interquartile 75% (IQ3) | 12.7% | 7.6% |
| Interquartile Range (IQR) | 5.5% | 2.4% |
| Standard Deviation (Sample) | 4.6% | 2.1% |
| Standard Deviation (Population) | 4.6% | 2.1% |
Similar Demographics by Ambulatory Disability
Demographics Similar to Potawatomi by Ambulatory Disability
In terms of ambulatory disability, the demographic groups most similar to Potawatomi are Apache (7.4%, a difference of 0.81%), Osage (7.4%, a difference of 0.95%), American (7.4%, a difference of 1.2%), Dominican (7.2%, a difference of 1.9%), and Ottawa (7.2%, a difference of 2.2%).
| Demographics | Rating | Rank | Ambulatory Disability |
| Immigrants | Yemen | 0.0 /100 | #313 | Tragic 7.1% |
| Blackfeet | 0.0 /100 | #314 | Tragic 7.1% |
| Shoshone | 0.0 /100 | #315 | Tragic 7.1% |
| Immigrants | Dominican Republic | 0.0 /100 | #316 | Tragic 7.1% |
| Central American Indians | 0.0 /100 | #317 | Tragic 7.2% |
| Ottawa | 0.0 /100 | #318 | Tragic 7.2% |
| Dominicans | 0.0 /100 | #319 | Tragic 7.2% |
| Potawatomi | 0.0 /100 | #320 | Tragic 7.3% |
| Apache | 0.0 /100 | #321 | Tragic 7.4% |
| Osage | 0.0 /100 | #322 | Tragic 7.4% |
| Americans | 0.0 /100 | #323 | Tragic 7.4% |
| Navajo | 0.0 /100 | #324 | Tragic 7.5% |
| Comanche | 0.0 /100 | #325 | Tragic 7.5% |
| Blacks/African Americans | 0.0 /100 | #326 | Tragic 7.5% |
| Natives/Alaskans | 0.0 /100 | #327 | Tragic 7.5% |
Demographics Similar to Trinidadians and Tobagonians by Ambulatory Disability
In terms of ambulatory disability, the demographic groups most similar to Trinidadians and Tobagonians are Spanish (6.6%, a difference of 0.020%), Guyanese (6.6%, a difference of 0.13%), Bahamian (6.6%, a difference of 0.25%), Nepalese (6.6%, a difference of 0.31%), and French (6.6%, a difference of 0.32%).
| Demographics | Rating | Rank | Ambulatory Disability |
| Immigrants | Belize | 0.4 /100 | #260 | Tragic 6.6% |
| Irish | 0.4 /100 | #261 | Tragic 6.6% |
| English | 0.4 /100 | #262 | Tragic 6.6% |
| Hmong | 0.3 /100 | #263 | Tragic 6.6% |
| Nepalese | 0.2 /100 | #264 | Tragic 6.6% |
| Bahamians | 0.2 /100 | #265 | Tragic 6.6% |
| Guyanese | 0.2 /100 | #266 | Tragic 6.6% |
| Trinidadians and Tobagonians | 0.2 /100 | #267 | Tragic 6.6% |
| Spanish | 0.2 /100 | #268 | Tragic 6.6% |
| French | 0.1 /100 | #269 | Tragic 6.6% |
| Slovaks | 0.1 /100 | #270 | Tragic 6.7% |
| Immigrants | Trinidad and Tobago | 0.1 /100 | #271 | Tragic 6.7% |
| French Canadians | 0.1 /100 | #272 | Tragic 6.7% |
| Whites/Caucasians | 0.1 /100 | #273 | Tragic 6.7% |
| Sioux | 0.1 /100 | #274 | Tragic 6.7% |