Scandinavian vs Egyptian Cognitive Disability
COMPARE
Scandinavian
Egyptian
Cognitive Disability
Cognitive Disability Comparison
Scandinavians
Egyptians
16.9%
COGNITIVE DISABILITY
94.1/ 100
METRIC RATING
125th/ 347
METRIC RANK
16.7%
COGNITIVE DISABILITY
99.2/ 100
METRIC RATING
80th/ 347
METRIC RANK
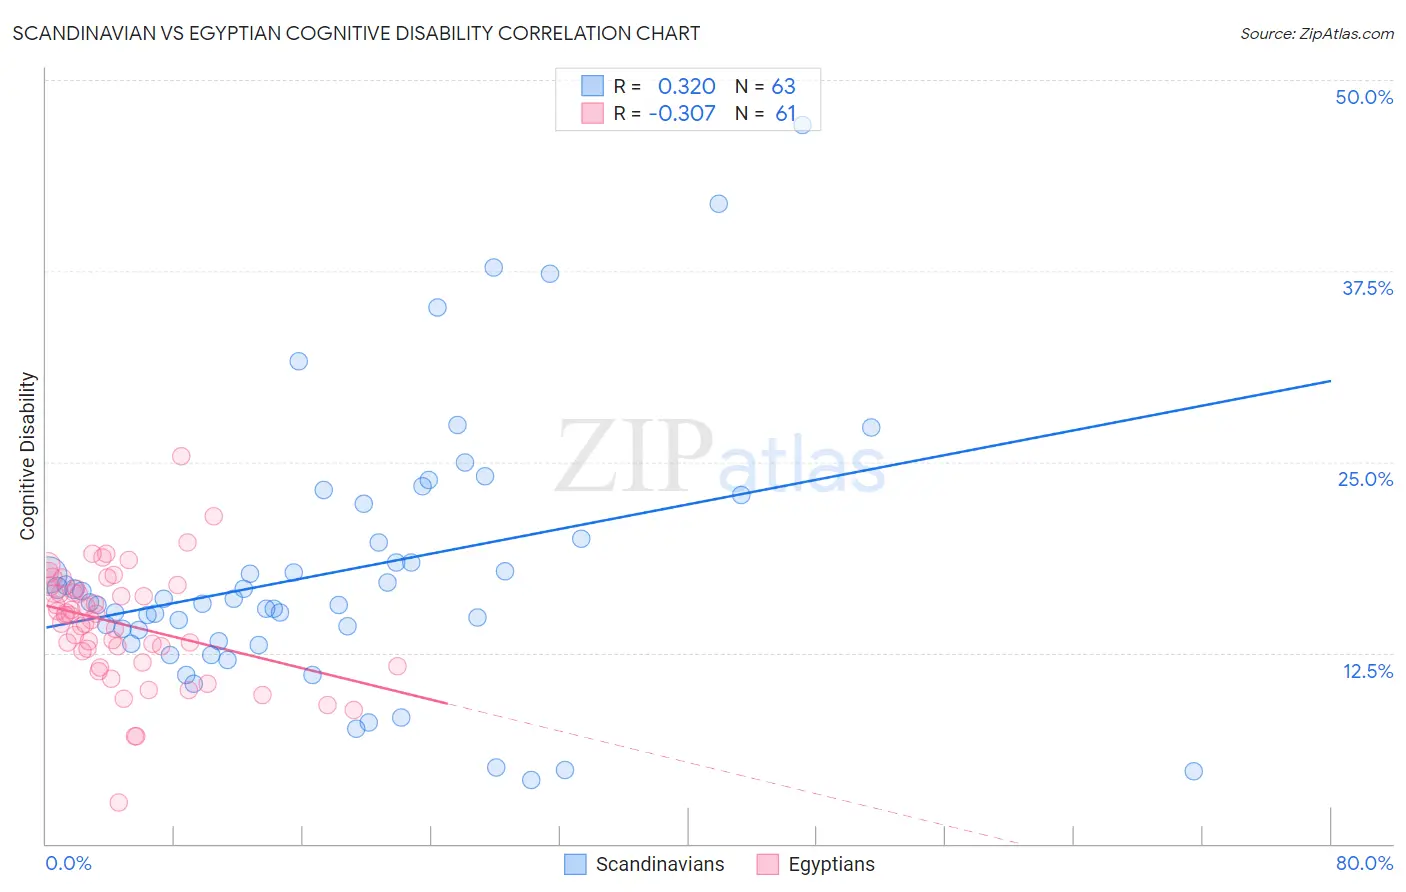
Scandinavian vs Egyptian Cognitive Disability Correlation Chart
The statistical analysis conducted on geographies consisting of 472,549,780 people shows a mild positive correlation between the proportion of Scandinavians and percentage of population with cognitive disability in the United States with a correlation coefficient (R) of 0.320 and weighted average of 16.9%. Similarly, the statistical analysis conducted on geographies consisting of 276,907,223 people shows a mild negative correlation between the proportion of Egyptians and percentage of population with cognitive disability in the United States with a correlation coefficient (R) of -0.307 and weighted average of 16.7%, a difference of 1.5%.
Cognitive Disability Correlation Summary
| Measurement | Scandinavian | Egyptian |
| Minimum | 4.2% | 2.7% |
| Maximum | 47.1% | 25.4% |
| Range | 42.9% | 22.7% |
| Mean | 17.8% | 14.4% |
| Median | 15.8% | 15.0% |
| Interquartile 25% (IQ1) | 13.3% | 12.2% |
| Interquartile 75% (IQ3) | 20.0% | 16.8% |
| Interquartile Range (IQR) | 6.7% | 4.6% |
| Standard Deviation (Sample) | 8.6% | 3.8% |
| Standard Deviation (Population) | 8.5% | 3.7% |
Similar Demographics by Cognitive Disability
Demographics Similar to Scandinavians by Cognitive Disability
In terms of cognitive disability, the demographic groups most similar to Scandinavians are Turkish (16.9%, a difference of 0.050%), Portuguese (16.9%, a difference of 0.080%), Immigrants from Western Europe (16.9%, a difference of 0.090%), European (17.0%, a difference of 0.090%), and Immigrants from China (16.9%, a difference of 0.10%).
| Demographics | Rating | Rank | Cognitive Disability |
| Immigrants | Denmark | 96.2 /100 | #118 | Exceptional 16.9% |
| South Africans | 95.5 /100 | #119 | Exceptional 16.9% |
| Scottish | 95.0 /100 | #120 | Exceptional 16.9% |
| Immigrants | China | 94.9 /100 | #121 | Exceptional 16.9% |
| Immigrants | Western Europe | 94.8 /100 | #122 | Exceptional 16.9% |
| Portuguese | 94.7 /100 | #123 | Exceptional 16.9% |
| Turks | 94.5 /100 | #124 | Exceptional 16.9% |
| Scandinavians | 94.1 /100 | #125 | Exceptional 16.9% |
| Europeans | 93.4 /100 | #126 | Exceptional 17.0% |
| Immigrants | Costa Rica | 93.1 /100 | #127 | Exceptional 17.0% |
| Nicaraguans | 93.0 /100 | #128 | Exceptional 17.0% |
| Immigrants | Uruguay | 92.9 /100 | #129 | Exceptional 17.0% |
| Immigrants | Vietnam | 92.4 /100 | #130 | Exceptional 17.0% |
| Immigrants | Germany | 92.1 /100 | #131 | Exceptional 17.0% |
| Whites/Caucasians | 92.1 /100 | #132 | Exceptional 17.0% |
Demographics Similar to Egyptians by Cognitive Disability
In terms of cognitive disability, the demographic groups most similar to Egyptians are Immigrants from Netherlands (16.7%, a difference of 0.010%), Peruvian (16.7%, a difference of 0.030%), Immigrants from Bulgaria (16.7%, a difference of 0.030%), Immigrants from Serbia (16.7%, a difference of 0.040%), and Immigrants from Hungary (16.7%, a difference of 0.040%).
| Demographics | Rating | Rank | Cognitive Disability |
| Burmese | 99.3 /100 | #73 | Exceptional 16.7% |
| Slavs | 99.3 /100 | #74 | Exceptional 16.7% |
| Estonians | 99.3 /100 | #75 | Exceptional 16.7% |
| Immigrants | Serbia | 99.3 /100 | #76 | Exceptional 16.7% |
| Immigrants | Hungary | 99.3 /100 | #77 | Exceptional 16.7% |
| Peruvians | 99.3 /100 | #78 | Exceptional 16.7% |
| Immigrants | Bulgaria | 99.3 /100 | #79 | Exceptional 16.7% |
| Egyptians | 99.2 /100 | #80 | Exceptional 16.7% |
| Immigrants | Netherlands | 99.2 /100 | #81 | Exceptional 16.7% |
| Swiss | 99.2 /100 | #82 | Exceptional 16.7% |
| Serbians | 99.1 /100 | #83 | Exceptional 16.7% |
| Belgians | 99.1 /100 | #84 | Exceptional 16.7% |
| Immigrants | Moldova | 99.1 /100 | #85 | Exceptional 16.7% |
| Immigrants | South Africa | 99.0 /100 | #86 | Exceptional 16.7% |
| Native Hawaiians | 99.0 /100 | #87 | Exceptional 16.7% |