Scandinavian vs Immigrants from Turkey Cognitive Disability
COMPARE
Scandinavian
Immigrants from Turkey
Cognitive Disability
Cognitive Disability Comparison
Scandinavians
Immigrants from Turkey
16.9%
COGNITIVE DISABILITY
94.1/ 100
METRIC RATING
125th/ 347
METRIC RANK
17.2%
COGNITIVE DISABILITY
56.7/ 100
METRIC RATING
172nd/ 347
METRIC RANK
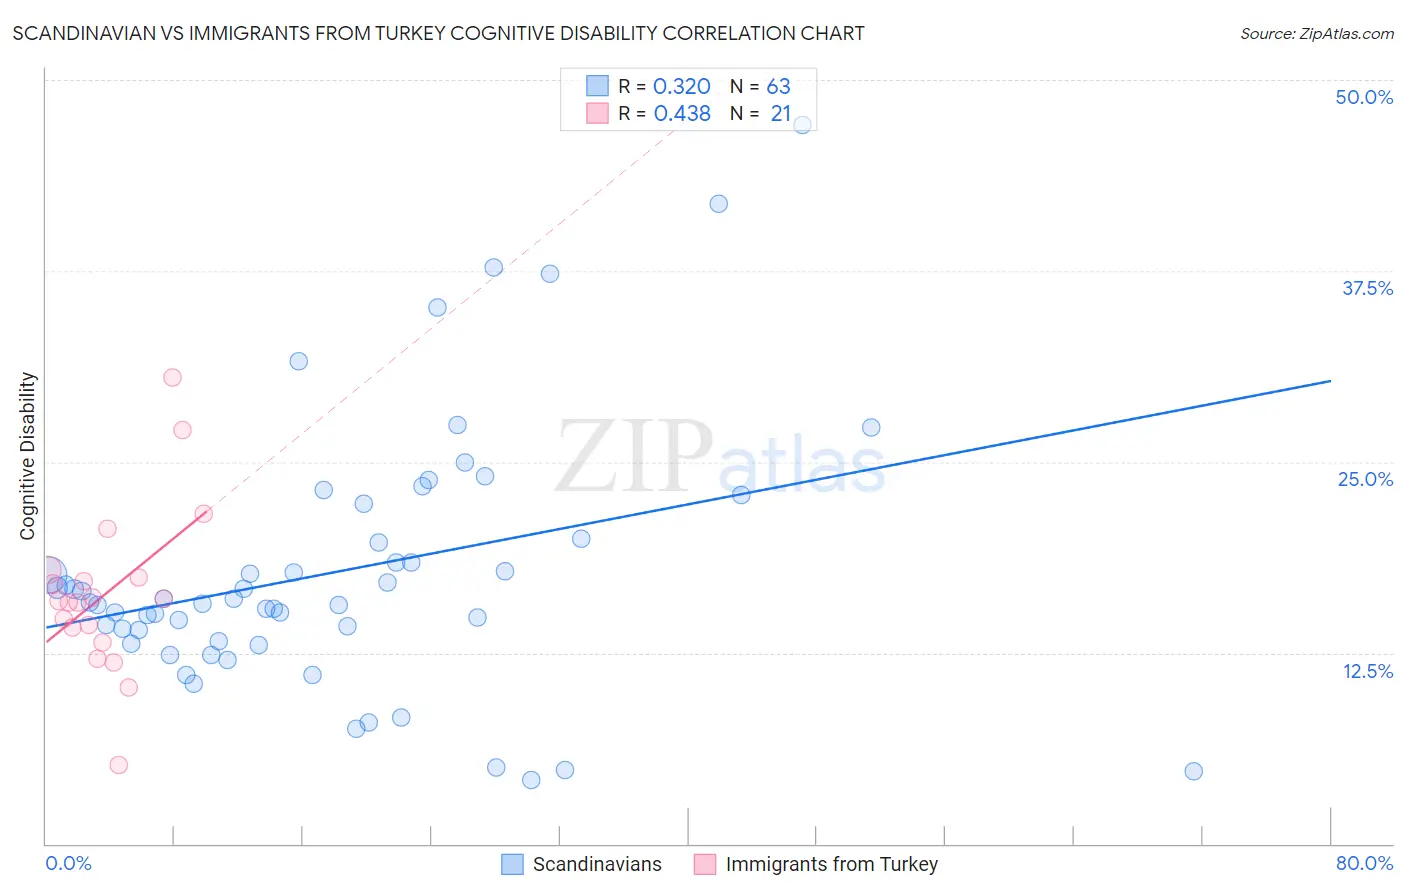
Scandinavian vs Immigrants from Turkey Cognitive Disability Correlation Chart
The statistical analysis conducted on geographies consisting of 472,549,780 people shows a mild positive correlation between the proportion of Scandinavians and percentage of population with cognitive disability in the United States with a correlation coefficient (R) of 0.320 and weighted average of 16.9%. Similarly, the statistical analysis conducted on geographies consisting of 223,051,603 people shows a moderate positive correlation between the proportion of Immigrants from Turkey and percentage of population with cognitive disability in the United States with a correlation coefficient (R) of 0.438 and weighted average of 17.2%, a difference of 1.8%.
Cognitive Disability Correlation Summary
| Measurement | Scandinavian | Immigrants from Turkey |
| Minimum | 4.2% | 5.2% |
| Maximum | 47.1% | 30.5% |
| Range | 42.9% | 25.3% |
| Mean | 17.8% | 16.4% |
| Median | 15.8% | 15.9% |
| Interquartile 25% (IQ1) | 13.3% | 13.7% |
| Interquartile 75% (IQ3) | 20.0% | 17.7% |
| Interquartile Range (IQR) | 6.7% | 4.0% |
| Standard Deviation (Sample) | 8.6% | 5.4% |
| Standard Deviation (Population) | 8.5% | 5.3% |
Similar Demographics by Cognitive Disability
Demographics Similar to Scandinavians by Cognitive Disability
In terms of cognitive disability, the demographic groups most similar to Scandinavians are Turkish (16.9%, a difference of 0.050%), Portuguese (16.9%, a difference of 0.080%), Immigrants from Western Europe (16.9%, a difference of 0.090%), European (17.0%, a difference of 0.090%), and Immigrants from China (16.9%, a difference of 0.10%).
| Demographics | Rating | Rank | Cognitive Disability |
| Immigrants | Denmark | 96.2 /100 | #118 | Exceptional 16.9% |
| South Africans | 95.5 /100 | #119 | Exceptional 16.9% |
| Scottish | 95.0 /100 | #120 | Exceptional 16.9% |
| Immigrants | China | 94.9 /100 | #121 | Exceptional 16.9% |
| Immigrants | Western Europe | 94.8 /100 | #122 | Exceptional 16.9% |
| Portuguese | 94.7 /100 | #123 | Exceptional 16.9% |
| Turks | 94.5 /100 | #124 | Exceptional 16.9% |
| Scandinavians | 94.1 /100 | #125 | Exceptional 16.9% |
| Europeans | 93.4 /100 | #126 | Exceptional 17.0% |
| Immigrants | Costa Rica | 93.1 /100 | #127 | Exceptional 17.0% |
| Nicaraguans | 93.0 /100 | #128 | Exceptional 17.0% |
| Immigrants | Uruguay | 92.9 /100 | #129 | Exceptional 17.0% |
| Immigrants | Vietnam | 92.4 /100 | #130 | Exceptional 17.0% |
| Immigrants | Germany | 92.1 /100 | #131 | Exceptional 17.0% |
| Whites/Caucasians | 92.1 /100 | #132 | Exceptional 17.0% |
Demographics Similar to Immigrants from Turkey by Cognitive Disability
In terms of cognitive disability, the demographic groups most similar to Immigrants from Turkey are Tlingit-Haida (17.2%, a difference of 0.080%), Ecuadorian (17.2%, a difference of 0.090%), Immigrants from Portugal (17.2%, a difference of 0.15%), Immigrants (17.2%, a difference of 0.17%), and Immigrants from Northern Africa (17.3%, a difference of 0.18%).
| Demographics | Rating | Rank | Cognitive Disability |
| Immigrants | Albania | 64.9 /100 | #165 | Good 17.2% |
| Immigrants | Ecuador | 64.4 /100 | #166 | Good 17.2% |
| Immigrants | Syria | 63.5 /100 | #167 | Good 17.2% |
| Immigrants | Immigrants | 62.5 /100 | #168 | Good 17.2% |
| Immigrants | Portugal | 61.8 /100 | #169 | Good 17.2% |
| Ecuadorians | 59.6 /100 | #170 | Average 17.2% |
| Tlingit-Haida | 59.4 /100 | #171 | Average 17.2% |
| Immigrants | Turkey | 56.7 /100 | #172 | Average 17.2% |
| Immigrants | Northern Africa | 50.2 /100 | #173 | Average 17.3% |
| Laotians | 50.0 /100 | #174 | Average 17.3% |
| Tsimshian | 49.8 /100 | #175 | Average 17.3% |
| Shoshone | 49.2 /100 | #176 | Average 17.3% |
| Ute | 49.1 /100 | #177 | Average 17.3% |
| Spanish | 48.9 /100 | #178 | Average 17.3% |
| Sioux | 48.6 /100 | #179 | Average 17.3% |