Eastern European vs Immigrants from Kuwait Cognitive Disability
COMPARE
Eastern European
Immigrants from Kuwait
Cognitive Disability
Cognitive Disability Comparison
Eastern Europeans
Immigrants from Kuwait
16.3%
COGNITIVE DISABILITY
100.0/ 100
METRIC RATING
16th/ 347
METRIC RANK
18.1%
COGNITIVE DISABILITY
0.2/ 100
METRIC RATING
277th/ 347
METRIC RANK
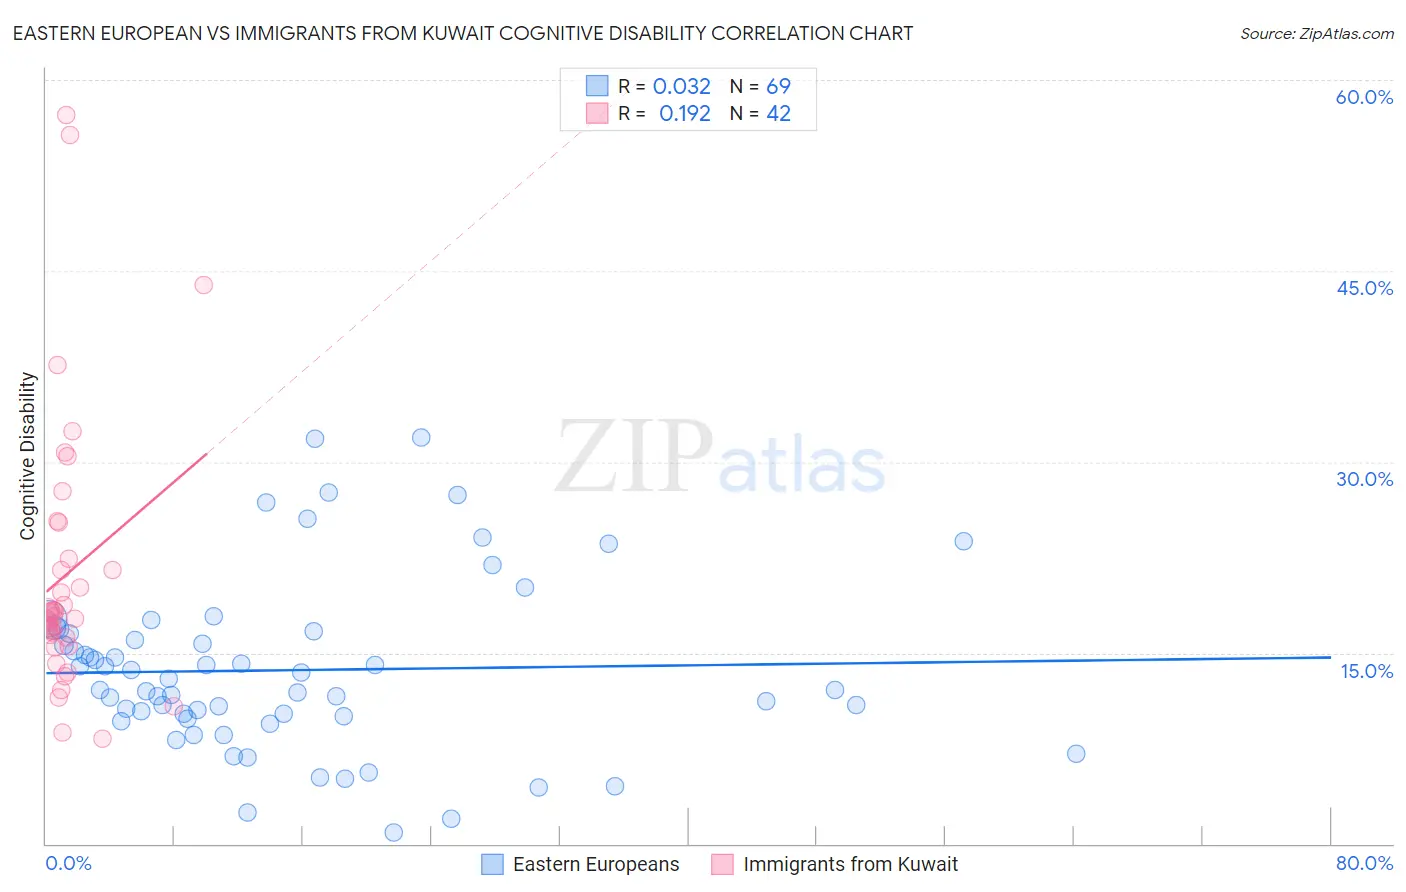
Eastern European vs Immigrants from Kuwait Cognitive Disability Correlation Chart
The statistical analysis conducted on geographies consisting of 461,204,050 people shows no correlation between the proportion of Eastern Europeans and percentage of population with cognitive disability in the United States with a correlation coefficient (R) of 0.032 and weighted average of 16.3%. Similarly, the statistical analysis conducted on geographies consisting of 136,916,630 people shows a poor positive correlation between the proportion of Immigrants from Kuwait and percentage of population with cognitive disability in the United States with a correlation coefficient (R) of 0.192 and weighted average of 18.1%, a difference of 10.8%.
Cognitive Disability Correlation Summary
| Measurement | Eastern European | Immigrants from Kuwait |
| Minimum | 0.87% | 8.3% |
| Maximum | 31.9% | 57.2% |
| Range | 31.0% | 49.0% |
| Mean | 13.6% | 21.2% |
| Median | 12.1% | 18.0% |
| Interquartile 25% (IQ1) | 9.9% | 16.2% |
| Interquartile 75% (IQ3) | 16.6% | 22.4% |
| Interquartile Range (IQR) | 6.7% | 6.3% |
| Standard Deviation (Sample) | 6.7% | 10.8% |
| Standard Deviation (Population) | 6.7% | 10.6% |
Similar Demographics by Cognitive Disability
Demographics Similar to Eastern Europeans by Cognitive Disability
In terms of cognitive disability, the demographic groups most similar to Eastern Europeans are Immigrants from North Macedonia (16.3%, a difference of 0.020%), Immigrants from Northern Europe (16.3%, a difference of 0.080%), Immigrants from Bolivia (16.3%, a difference of 0.090%), Bulgarian (16.3%, a difference of 0.10%), and Immigrants from Cuba (16.3%, a difference of 0.14%).
| Demographics | Rating | Rank | Cognitive Disability |
| Assyrians/Chaldeans/Syriacs | 100.0 /100 | #9 | Exceptional 16.2% |
| Immigrants | Scotland | 100.0 /100 | #10 | Exceptional 16.2% |
| Immigrants | Czechoslovakia | 100.0 /100 | #11 | Exceptional 16.2% |
| Maltese | 100.0 /100 | #12 | Exceptional 16.2% |
| Lithuanians | 100.0 /100 | #13 | Exceptional 16.3% |
| Immigrants | Austria | 100.0 /100 | #14 | Exceptional 16.3% |
| Immigrants | Greece | 100.0 /100 | #15 | Exceptional 16.3% |
| Eastern Europeans | 100.0 /100 | #16 | Exceptional 16.3% |
| Immigrants | North Macedonia | 100.0 /100 | #17 | Exceptional 16.3% |
| Immigrants | Northern Europe | 100.0 /100 | #18 | Exceptional 16.3% |
| Immigrants | Bolivia | 100.0 /100 | #19 | Exceptional 16.3% |
| Bulgarians | 100.0 /100 | #20 | Exceptional 16.3% |
| Immigrants | Cuba | 100.0 /100 | #21 | Exceptional 16.3% |
| Immigrants | South Central Asia | 99.9 /100 | #22 | Exceptional 16.4% |
| Croatians | 99.9 /100 | #23 | Exceptional 16.4% |
Demographics Similar to Immigrants from Kuwait by Cognitive Disability
In terms of cognitive disability, the demographic groups most similar to Immigrants from Kuwait are Yuman (18.1%, a difference of 0.0%), Immigrants from Micronesia (18.1%, a difference of 0.010%), Immigrants from Laos (18.1%, a difference of 0.050%), Chippewa (18.1%, a difference of 0.060%), and West Indian (18.1%, a difference of 0.070%).
| Demographics | Rating | Rank | Cognitive Disability |
| Immigrants | Bahamas | 0.3 /100 | #270 | Tragic 18.0% |
| Potawatomi | 0.2 /100 | #271 | Tragic 18.0% |
| Immigrants | Honduras | 0.2 /100 | #272 | Tragic 18.0% |
| Immigrants | Nepal | 0.2 /100 | #273 | Tragic 18.0% |
| Immigrants | Nigeria | 0.2 /100 | #274 | Tragic 18.0% |
| Immigrants | Laos | 0.2 /100 | #275 | Tragic 18.1% |
| Yuman | 0.2 /100 | #276 | Tragic 18.1% |
| Immigrants | Kuwait | 0.2 /100 | #277 | Tragic 18.1% |
| Immigrants | Micronesia | 0.2 /100 | #278 | Tragic 18.1% |
| Chippewa | 0.1 /100 | #279 | Tragic 18.1% |
| West Indians | 0.1 /100 | #280 | Tragic 18.1% |
| Yakama | 0.1 /100 | #281 | Tragic 18.1% |
| Immigrants | Cambodia | 0.1 /100 | #282 | Tragic 18.1% |
| Nigerians | 0.1 /100 | #283 | Tragic 18.1% |
| Immigrants | Uganda | 0.1 /100 | #284 | Tragic 18.1% |