Immigrants from Burma/Myanmar vs Immigrants from Kuwait Cognitive Disability
COMPARE
Immigrants from Burma/Myanmar
Immigrants from Kuwait
Cognitive Disability
Cognitive Disability Comparison
Immigrants from Burma/Myanmar
Immigrants from Kuwait
18.2%
COGNITIVE DISABILITY
0.0/ 100
METRIC RATING
296th/ 347
METRIC RANK
18.1%
COGNITIVE DISABILITY
0.2/ 100
METRIC RATING
277th/ 347
METRIC RANK
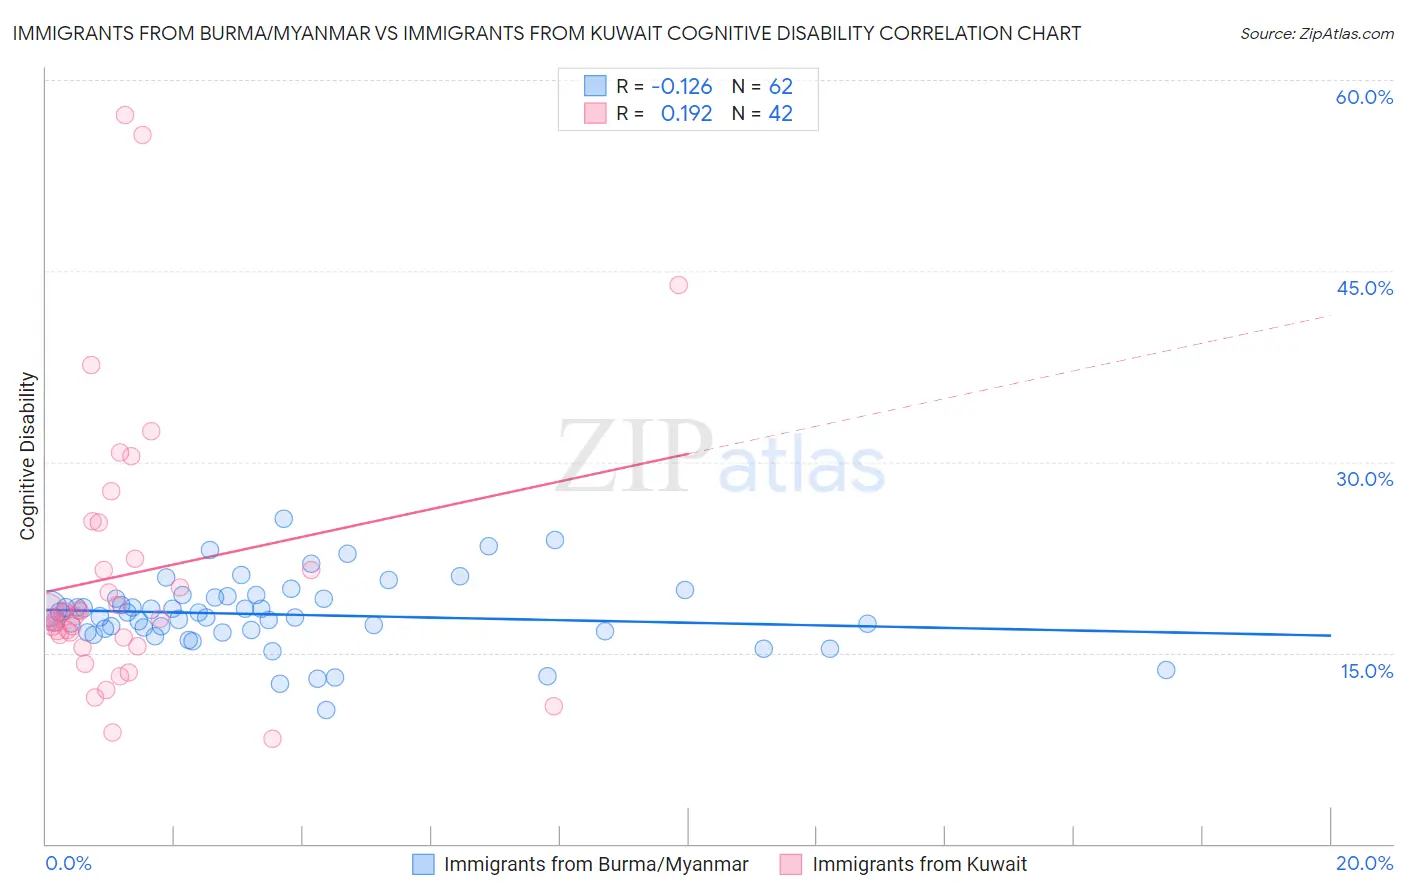
Immigrants from Burma/Myanmar vs Immigrants from Kuwait Cognitive Disability Correlation Chart
The statistical analysis conducted on geographies consisting of 172,345,235 people shows a poor negative correlation between the proportion of Immigrants from Burma/Myanmar and percentage of population with cognitive disability in the United States with a correlation coefficient (R) of -0.126 and weighted average of 18.2%. Similarly, the statistical analysis conducted on geographies consisting of 136,916,630 people shows a poor positive correlation between the proportion of Immigrants from Kuwait and percentage of population with cognitive disability in the United States with a correlation coefficient (R) of 0.192 and weighted average of 18.1%, a difference of 0.89%.
Cognitive Disability Correlation Summary
| Measurement | Immigrants from Burma/Myanmar | Immigrants from Kuwait |
| Minimum | 10.5% | 8.3% |
| Maximum | 25.5% | 57.2% |
| Range | 15.0% | 49.0% |
| Mean | 18.0% | 21.2% |
| Median | 18.0% | 18.0% |
| Interquartile 25% (IQ1) | 16.7% | 16.2% |
| Interquartile 75% (IQ3) | 19.3% | 22.4% |
| Interquartile Range (IQR) | 2.6% | 6.3% |
| Standard Deviation (Sample) | 2.8% | 10.8% |
| Standard Deviation (Population) | 2.7% | 10.6% |
Demographics Similar to Immigrants from Burma/Myanmar and Immigrants from Kuwait by Cognitive Disability
In terms of cognitive disability, the demographic groups most similar to Immigrants from Burma/Myanmar are German Russian (18.2%, a difference of 0.020%), British West Indian (18.2%, a difference of 0.20%), Iroquois (18.2%, a difference of 0.27%), Central American Indian (18.2%, a difference of 0.27%), and Ottawa (18.2%, a difference of 0.35%). Similarly, the demographic groups most similar to Immigrants from Kuwait are Yuman (18.1%, a difference of 0.0%), Immigrants from Micronesia (18.1%, a difference of 0.010%), Chippewa (18.1%, a difference of 0.060%), West Indian (18.1%, a difference of 0.070%), and Yakama (18.1%, a difference of 0.19%).
| Demographics | Rating | Rank | Cognitive Disability |
| Yuman | 0.2 /100 | #276 | Tragic 18.1% |
| Immigrants | Kuwait | 0.2 /100 | #277 | Tragic 18.1% |
| Immigrants | Micronesia | 0.2 /100 | #278 | Tragic 18.1% |
| Chippewa | 0.1 /100 | #279 | Tragic 18.1% |
| West Indians | 0.1 /100 | #280 | Tragic 18.1% |
| Yakama | 0.1 /100 | #281 | Tragic 18.1% |
| Immigrants | Cambodia | 0.1 /100 | #282 | Tragic 18.1% |
| Nigerians | 0.1 /100 | #283 | Tragic 18.1% |
| Immigrants | Uganda | 0.1 /100 | #284 | Tragic 18.1% |
| Bermudans | 0.1 /100 | #285 | Tragic 18.1% |
| Kenyans | 0.1 /100 | #286 | Tragic 18.1% |
| Dutch West Indians | 0.1 /100 | #287 | Tragic 18.1% |
| Immigrants | West Indies | 0.1 /100 | #288 | Tragic 18.1% |
| Natives/Alaskans | 0.1 /100 | #289 | Tragic 18.1% |
| Immigrants | Africa | 0.1 /100 | #290 | Tragic 18.1% |
| Ottawa | 0.1 /100 | #291 | Tragic 18.2% |
| Iroquois | 0.1 /100 | #292 | Tragic 18.2% |
| Central American Indians | 0.1 /100 | #293 | Tragic 18.2% |
| British West Indians | 0.1 /100 | #294 | Tragic 18.2% |
| German Russians | 0.0 /100 | #295 | Tragic 18.2% |
| Immigrants | Burma/Myanmar | 0.0 /100 | #296 | Tragic 18.2% |