Japanese vs Immigrants from Kuwait Cognitive Disability
COMPARE
Japanese
Immigrants from Kuwait
Cognitive Disability
Cognitive Disability Comparison
Japanese
Immigrants from Kuwait
18.3%
COGNITIVE DISABILITY
0.0/ 100
METRIC RATING
298th/ 347
METRIC RANK
18.1%
COGNITIVE DISABILITY
0.2/ 100
METRIC RATING
277th/ 347
METRIC RANK
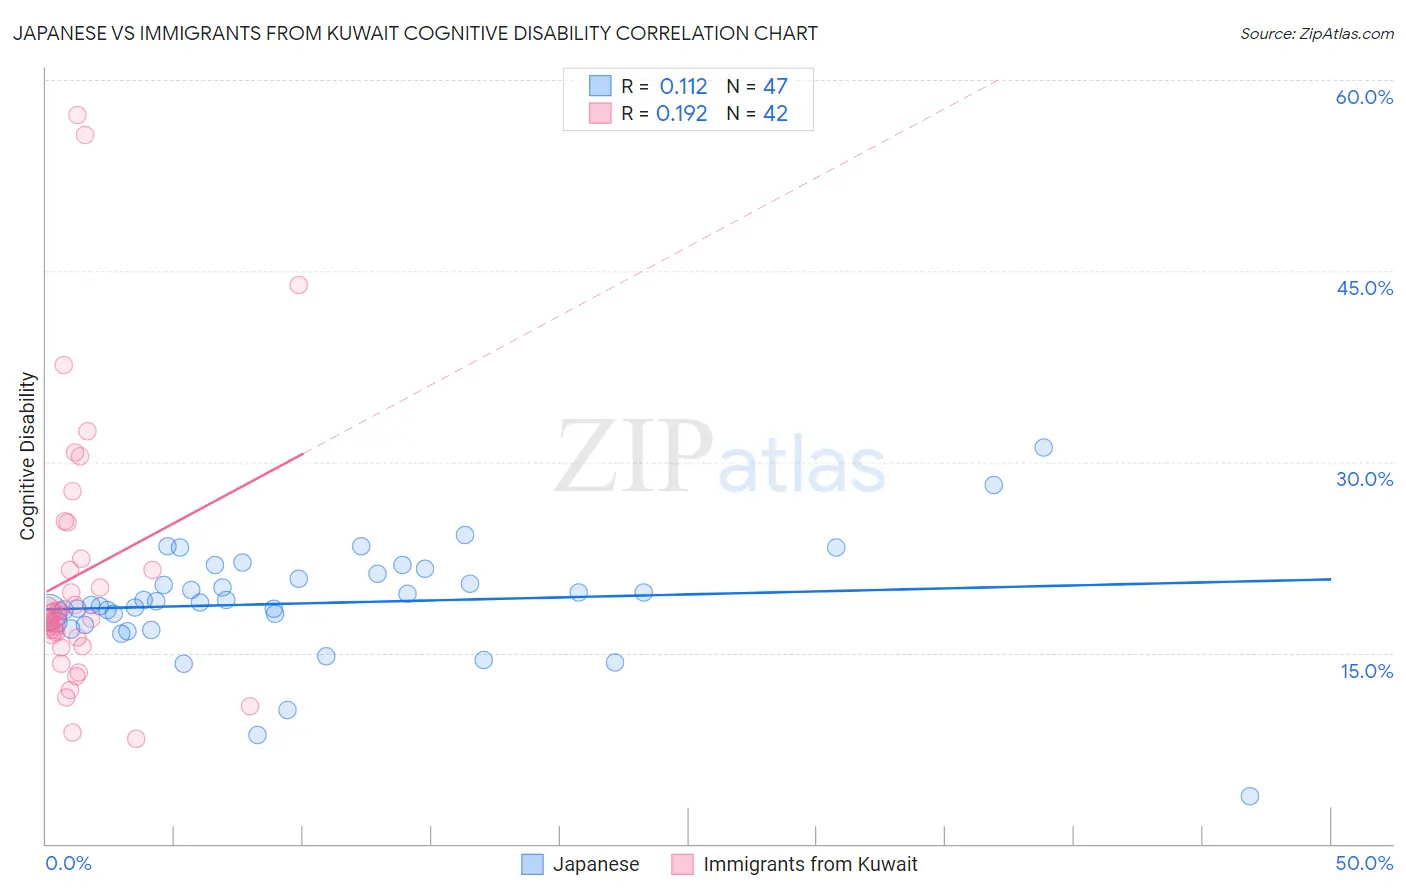
Japanese vs Immigrants from Kuwait Cognitive Disability Correlation Chart
The statistical analysis conducted on geographies consisting of 249,155,070 people shows a poor positive correlation between the proportion of Japanese and percentage of population with cognitive disability in the United States with a correlation coefficient (R) of 0.112 and weighted average of 18.3%. Similarly, the statistical analysis conducted on geographies consisting of 136,916,630 people shows a poor positive correlation between the proportion of Immigrants from Kuwait and percentage of population with cognitive disability in the United States with a correlation coefficient (R) of 0.192 and weighted average of 18.1%, a difference of 1.0%.
Cognitive Disability Correlation Summary
| Measurement | Japanese | Immigrants from Kuwait |
| Minimum | 3.7% | 8.3% |
| Maximum | 31.2% | 57.2% |
| Range | 27.4% | 49.0% |
| Mean | 18.9% | 21.2% |
| Median | 18.9% | 18.0% |
| Interquartile 25% (IQ1) | 17.2% | 16.2% |
| Interquartile 75% (IQ3) | 21.2% | 22.4% |
| Interquartile Range (IQR) | 4.0% | 6.3% |
| Standard Deviation (Sample) | 4.5% | 10.8% |
| Standard Deviation (Population) | 4.4% | 10.6% |
Similar Demographics by Cognitive Disability
Demographics Similar to Japanese by Cognitive Disability
In terms of cognitive disability, the demographic groups most similar to Japanese are Blackfeet (18.3%, a difference of 0.0%), Ghanaian (18.3%, a difference of 0.030%), Creek (18.3%, a difference of 0.060%), Immigrants from Burma/Myanmar (18.2%, a difference of 0.14%), and German Russian (18.2%, a difference of 0.17%).
| Demographics | Rating | Rank | Cognitive Disability |
| Ottawa | 0.1 /100 | #291 | Tragic 18.2% |
| Iroquois | 0.1 /100 | #292 | Tragic 18.2% |
| Central American Indians | 0.1 /100 | #293 | Tragic 18.2% |
| British West Indians | 0.1 /100 | #294 | Tragic 18.2% |
| German Russians | 0.0 /100 | #295 | Tragic 18.2% |
| Immigrants | Burma/Myanmar | 0.0 /100 | #296 | Tragic 18.2% |
| Blackfeet | 0.0 /100 | #297 | Tragic 18.3% |
| Japanese | 0.0 /100 | #298 | Tragic 18.3% |
| Ghanaians | 0.0 /100 | #299 | Tragic 18.3% |
| Creek | 0.0 /100 | #300 | Tragic 18.3% |
| Immigrants | Ghana | 0.0 /100 | #301 | Tragic 18.3% |
| Barbadians | 0.0 /100 | #302 | Tragic 18.3% |
| Immigrants | Kenya | 0.0 /100 | #303 | Tragic 18.3% |
| Immigrants | Eritrea | 0.0 /100 | #304 | Tragic 18.3% |
| Colville | 0.0 /100 | #305 | Tragic 18.3% |
Demographics Similar to Immigrants from Kuwait by Cognitive Disability
In terms of cognitive disability, the demographic groups most similar to Immigrants from Kuwait are Yuman (18.1%, a difference of 0.0%), Immigrants from Micronesia (18.1%, a difference of 0.010%), Immigrants from Laos (18.1%, a difference of 0.050%), Chippewa (18.1%, a difference of 0.060%), and West Indian (18.1%, a difference of 0.070%).
| Demographics | Rating | Rank | Cognitive Disability |
| Immigrants | Bahamas | 0.3 /100 | #270 | Tragic 18.0% |
| Potawatomi | 0.2 /100 | #271 | Tragic 18.0% |
| Immigrants | Honduras | 0.2 /100 | #272 | Tragic 18.0% |
| Immigrants | Nepal | 0.2 /100 | #273 | Tragic 18.0% |
| Immigrants | Nigeria | 0.2 /100 | #274 | Tragic 18.0% |
| Immigrants | Laos | 0.2 /100 | #275 | Tragic 18.1% |
| Yuman | 0.2 /100 | #276 | Tragic 18.1% |
| Immigrants | Kuwait | 0.2 /100 | #277 | Tragic 18.1% |
| Immigrants | Micronesia | 0.2 /100 | #278 | Tragic 18.1% |
| Chippewa | 0.1 /100 | #279 | Tragic 18.1% |
| West Indians | 0.1 /100 | #280 | Tragic 18.1% |
| Yakama | 0.1 /100 | #281 | Tragic 18.1% |
| Immigrants | Cambodia | 0.1 /100 | #282 | Tragic 18.1% |
| Nigerians | 0.1 /100 | #283 | Tragic 18.1% |
| Immigrants | Uganda | 0.1 /100 | #284 | Tragic 18.1% |