Ukrainian vs Immigrants from Kuwait Cognitive Disability
COMPARE
Ukrainian
Immigrants from Kuwait
Cognitive Disability
Cognitive Disability Comparison
Ukrainians
Immigrants from Kuwait
16.6%
COGNITIVE DISABILITY
99.4/ 100
METRIC RATING
68th/ 347
METRIC RANK
18.1%
COGNITIVE DISABILITY
0.2/ 100
METRIC RATING
277th/ 347
METRIC RANK
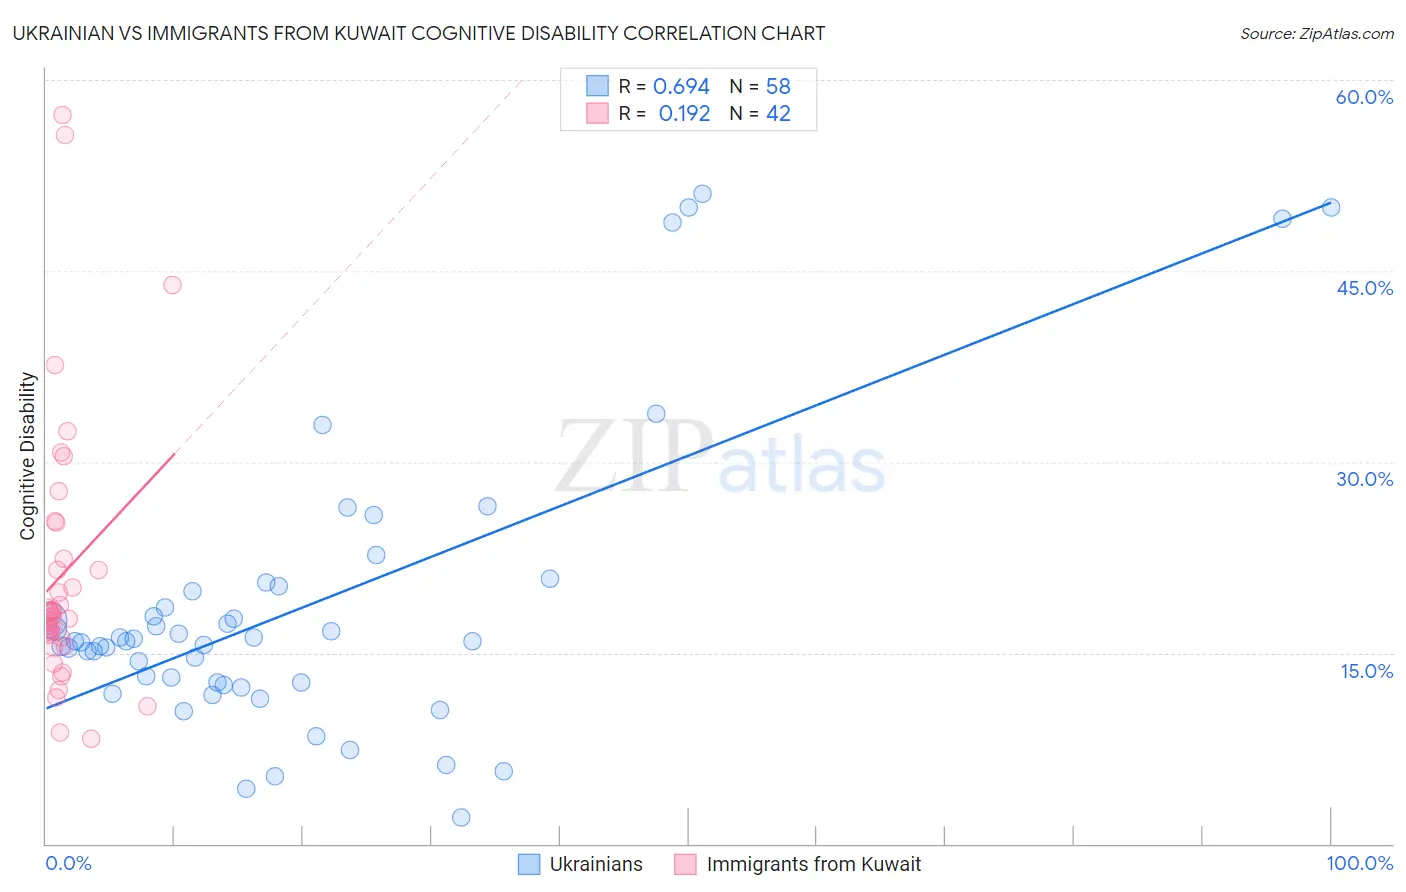
Ukrainian vs Immigrants from Kuwait Cognitive Disability Correlation Chart
The statistical analysis conducted on geographies consisting of 448,632,729 people shows a significant positive correlation between the proportion of Ukrainians and percentage of population with cognitive disability in the United States with a correlation coefficient (R) of 0.694 and weighted average of 16.6%. Similarly, the statistical analysis conducted on geographies consisting of 136,916,630 people shows a poor positive correlation between the proportion of Immigrants from Kuwait and percentage of population with cognitive disability in the United States with a correlation coefficient (R) of 0.192 and weighted average of 18.1%, a difference of 8.6%.
Cognitive Disability Correlation Summary
| Measurement | Ukrainian | Immigrants from Kuwait |
| Minimum | 2.1% | 8.3% |
| Maximum | 51.1% | 57.2% |
| Range | 49.0% | 49.0% |
| Mean | 18.5% | 21.2% |
| Median | 15.9% | 18.0% |
| Interquartile 25% (IQ1) | 12.6% | 16.2% |
| Interquartile 75% (IQ3) | 19.9% | 22.4% |
| Interquartile Range (IQR) | 7.2% | 6.3% |
| Standard Deviation (Sample) | 11.4% | 10.8% |
| Standard Deviation (Population) | 11.3% | 10.6% |
Similar Demographics by Cognitive Disability
Demographics Similar to Ukrainians by Cognitive Disability
In terms of cognitive disability, the demographic groups most similar to Ukrainians are Latvian (16.6%, a difference of 0.040%), Immigrants from Ukraine (16.6%, a difference of 0.080%), Immigrants from Uzbekistan (16.7%, a difference of 0.080%), Immigrants from Sweden (16.7%, a difference of 0.090%), and Immigrants from Belgium (16.7%, a difference of 0.10%).
| Demographics | Rating | Rank | Cognitive Disability |
| Immigrants | England | 99.6 /100 | #61 | Exceptional 16.6% |
| Czechoslovakians | 99.6 /100 | #62 | Exceptional 16.6% |
| Argentineans | 99.6 /100 | #63 | Exceptional 16.6% |
| Venezuelans | 99.6 /100 | #64 | Exceptional 16.6% |
| Colombians | 99.6 /100 | #65 | Exceptional 16.6% |
| Immigrants | Ukraine | 99.5 /100 | #66 | Exceptional 16.6% |
| Latvians | 99.5 /100 | #67 | Exceptional 16.6% |
| Ukrainians | 99.4 /100 | #68 | Exceptional 16.6% |
| Immigrants | Uzbekistan | 99.4 /100 | #69 | Exceptional 16.7% |
| Immigrants | Sweden | 99.4 /100 | #70 | Exceptional 16.7% |
| Immigrants | Belgium | 99.3 /100 | #71 | Exceptional 16.7% |
| Germans | 99.3 /100 | #72 | Exceptional 16.7% |
| Burmese | 99.3 /100 | #73 | Exceptional 16.7% |
| Slavs | 99.3 /100 | #74 | Exceptional 16.7% |
| Estonians | 99.3 /100 | #75 | Exceptional 16.7% |
Demographics Similar to Immigrants from Kuwait by Cognitive Disability
In terms of cognitive disability, the demographic groups most similar to Immigrants from Kuwait are Yuman (18.1%, a difference of 0.0%), Immigrants from Micronesia (18.1%, a difference of 0.010%), Immigrants from Laos (18.1%, a difference of 0.050%), Chippewa (18.1%, a difference of 0.060%), and West Indian (18.1%, a difference of 0.070%).
| Demographics | Rating | Rank | Cognitive Disability |
| Immigrants | Bahamas | 0.3 /100 | #270 | Tragic 18.0% |
| Potawatomi | 0.2 /100 | #271 | Tragic 18.0% |
| Immigrants | Honduras | 0.2 /100 | #272 | Tragic 18.0% |
| Immigrants | Nepal | 0.2 /100 | #273 | Tragic 18.0% |
| Immigrants | Nigeria | 0.2 /100 | #274 | Tragic 18.0% |
| Immigrants | Laos | 0.2 /100 | #275 | Tragic 18.1% |
| Yuman | 0.2 /100 | #276 | Tragic 18.1% |
| Immigrants | Kuwait | 0.2 /100 | #277 | Tragic 18.1% |
| Immigrants | Micronesia | 0.2 /100 | #278 | Tragic 18.1% |
| Chippewa | 0.1 /100 | #279 | Tragic 18.1% |
| West Indians | 0.1 /100 | #280 | Tragic 18.1% |
| Yakama | 0.1 /100 | #281 | Tragic 18.1% |
| Immigrants | Cambodia | 0.1 /100 | #282 | Tragic 18.1% |
| Nigerians | 0.1 /100 | #283 | Tragic 18.1% |
| Immigrants | Uganda | 0.1 /100 | #284 | Tragic 18.1% |