French vs Carpatho Rusyn Male Disability
COMPARE
French
Carpatho Rusyn
Male Disability
Male Disability Comparison
French
Carpatho Rusyns
13.0%
MALE DISABILITY
0.0/ 100
METRIC RATING
301st/ 347
METRIC RANK
11.9%
MALE DISABILITY
1.3/ 100
METRIC RATING
237th/ 347
METRIC RANK
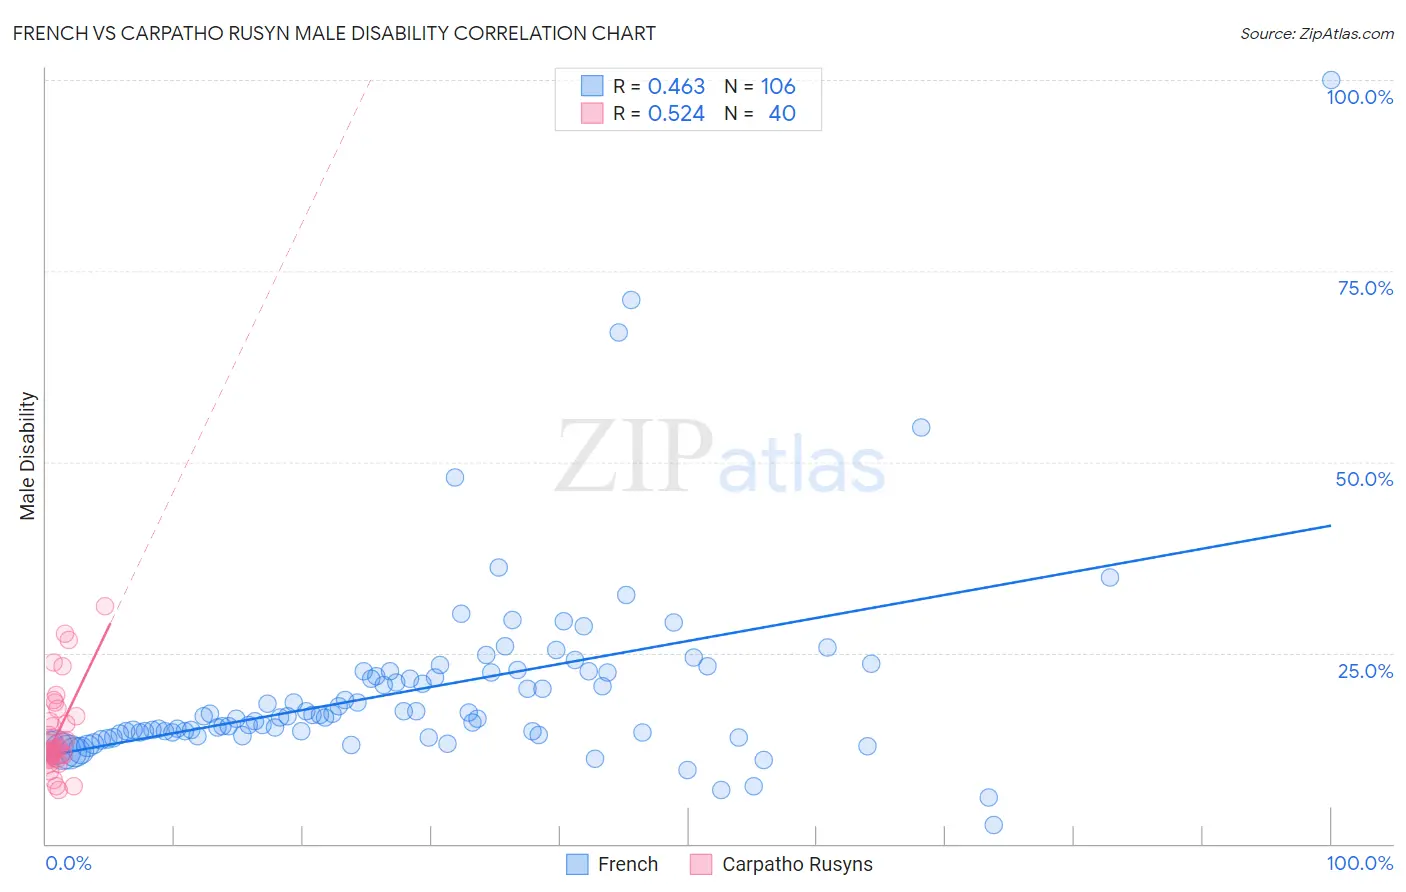
French vs Carpatho Rusyn Male Disability Correlation Chart
The statistical analysis conducted on geographies consisting of 572,141,225 people shows a moderate positive correlation between the proportion of French and percentage of males with a disability in the United States with a correlation coefficient (R) of 0.463 and weighted average of 13.0%. Similarly, the statistical analysis conducted on geographies consisting of 58,870,293 people shows a substantial positive correlation between the proportion of Carpatho Rusyns and percentage of males with a disability in the United States with a correlation coefficient (R) of 0.524 and weighted average of 11.9%, a difference of 9.7%.
Male Disability Correlation Summary
| Measurement | French | Carpatho Rusyn |
| Minimum | 2.5% | 7.0% |
| Maximum | 100.0% | 31.1% |
| Range | 97.5% | 24.1% |
| Mean | 20.1% | 14.4% |
| Median | 16.6% | 12.4% |
| Interquartile 25% (IQ1) | 14.3% | 11.3% |
| Interquartile 75% (IQ3) | 22.4% | 16.4% |
| Interquartile Range (IQR) | 8.1% | 5.1% |
| Standard Deviation (Sample) | 12.8% | 5.5% |
| Standard Deviation (Population) | 12.8% | 5.5% |
Similar Demographics by Male Disability
Demographics Similar to French by Male Disability
In terms of male disability, the demographic groups most similar to French are Cheyenne (13.0%, a difference of 0.040%), Celtic (13.0%, a difference of 0.13%), Pennsylvania German (13.0%, a difference of 0.48%), Crow (13.1%, a difference of 0.58%), and Inupiat (13.0%, a difference of 0.69%).
| Demographics | Rating | Rank | Male Disability |
| Marshallese | 0.0 /100 | #294 | Tragic 12.9% |
| Immigrants | Micronesia | 0.0 /100 | #295 | Tragic 12.9% |
| Immigrants | Nonimmigrants | 0.0 /100 | #296 | Tragic 12.9% |
| Inupiat | 0.0 /100 | #297 | Tragic 13.0% |
| Pennsylvania Germans | 0.0 /100 | #298 | Tragic 13.0% |
| Celtics | 0.0 /100 | #299 | Tragic 13.0% |
| Cheyenne | 0.0 /100 | #300 | Tragic 13.0% |
| French | 0.0 /100 | #301 | Tragic 13.0% |
| Crow | 0.0 /100 | #302 | Tragic 13.1% |
| Scotch-Irish | 0.0 /100 | #303 | Tragic 13.2% |
| Blacks/African Americans | 0.0 /100 | #304 | Tragic 13.2% |
| French Canadians | 0.0 /100 | #305 | Tragic 13.3% |
| Spanish Americans | 0.0 /100 | #306 | Tragic 13.3% |
| Arapaho | 0.0 /100 | #307 | Tragic 13.3% |
| French American Indians | 0.0 /100 | #308 | Tragic 13.4% |
Demographics Similar to Carpatho Rusyns by Male Disability
In terms of male disability, the demographic groups most similar to Carpatho Rusyns are U.S. Virgin Islander (11.9%, a difference of 0.010%), Yugoslavian (11.9%, a difference of 0.10%), Immigrants from North America (11.9%, a difference of 0.15%), Italian (11.9%, a difference of 0.15%), and Czech (11.9%, a difference of 0.20%).
| Demographics | Rating | Rank | Male Disability |
| Croatians | 2.1 /100 | #230 | Tragic 11.8% |
| Dominicans | 1.8 /100 | #231 | Tragic 11.8% |
| Malaysians | 1.8 /100 | #232 | Tragic 11.8% |
| Mexicans | 1.7 /100 | #233 | Tragic 11.8% |
| Immigrants | Canada | 1.6 /100 | #234 | Tragic 11.9% |
| Immigrants | North America | 1.5 /100 | #235 | Tragic 11.9% |
| U.S. Virgin Islanders | 1.3 /100 | #236 | Tragic 11.9% |
| Carpatho Rusyns | 1.3 /100 | #237 | Tragic 11.9% |
| Yugoslavians | 1.2 /100 | #238 | Tragic 11.9% |
| Italians | 1.2 /100 | #239 | Tragic 11.9% |
| Czechs | 1.1 /100 | #240 | Tragic 11.9% |
| Bahamians | 1.1 /100 | #241 | Tragic 11.9% |
| Northern Europeans | 1.1 /100 | #242 | Tragic 11.9% |
| Samoans | 1.1 /100 | #243 | Tragic 11.9% |
| Immigrants | Laos | 1.0 /100 | #244 | Tragic 11.9% |