Sierra Leonean vs Yakama Disability Age 5 to 17
COMPARE
Sierra Leonean
Yakama
Disability Age 5 to 17
Disability Age 5 to 17 Comparison
Sierra Leoneans
Yakama
5.8%
DISABILITY AGE 5 TO 17
7.0/ 100
METRIC RATING
219th/ 347
METRIC RANK
6.3%
DISABILITY AGE 5 TO 17
0.0/ 100
METRIC RATING
303rd/ 347
METRIC RANK
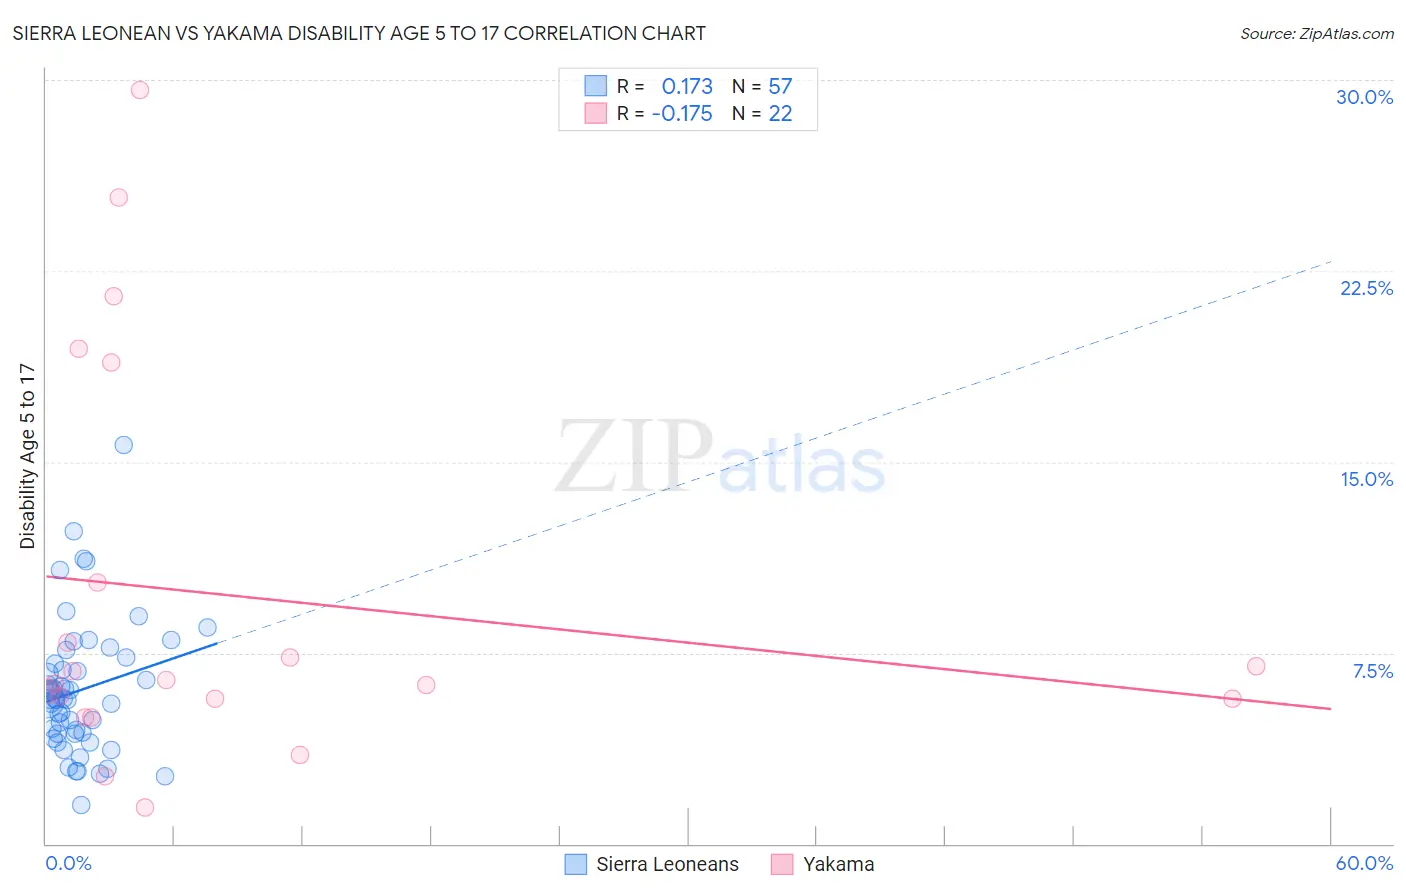
Sierra Leonean vs Yakama Disability Age 5 to 17 Correlation Chart
The statistical analysis conducted on geographies consisting of 83,260,070 people shows a poor positive correlation between the proportion of Sierra Leoneans and percentage of population with a disability between the ages 5 and 17 in the United States with a correlation coefficient (R) of 0.173 and weighted average of 5.8%. Similarly, the statistical analysis conducted on geographies consisting of 19,874,624 people shows a poor negative correlation between the proportion of Yakama and percentage of population with a disability between the ages 5 and 17 in the United States with a correlation coefficient (R) of -0.175 and weighted average of 6.3%, a difference of 8.9%.
Disability Age 5 to 17 Correlation Summary
| Measurement | Sierra Leonean | Yakama |
| Minimum | 1.5% | 1.4% |
| Maximum | 15.7% | 29.6% |
| Range | 14.2% | 28.2% |
| Mean | 6.0% | 9.7% |
| Median | 5.7% | 6.4% |
| Interquartile 25% (IQ1) | 4.3% | 5.7% |
| Interquartile 75% (IQ3) | 7.2% | 10.3% |
| Interquartile Range (IQR) | 2.9% | 4.6% |
| Standard Deviation (Sample) | 2.6% | 7.8% |
| Standard Deviation (Population) | 2.6% | 7.6% |
Similar Demographics by Disability Age 5 to 17
Demographics Similar to Sierra Leoneans by Disability Age 5 to 17
In terms of disability age 5 to 17, the demographic groups most similar to Sierra Leoneans are Immigrants from Sierra Leone (5.8%, a difference of 0.010%), Belgian (5.8%, a difference of 0.010%), Lithuanian (5.8%, a difference of 0.050%), Czech (5.8%, a difference of 0.060%), and Immigrants from Sudan (5.8%, a difference of 0.060%).
| Demographics | Rating | Rank | Disability Age 5 to 17 |
| Immigrants | Panama | 8.7 /100 | #212 | Tragic 5.8% |
| Immigrants | Cameroon | 8.3 /100 | #213 | Tragic 5.8% |
| Immigrants | Morocco | 8.3 /100 | #214 | Tragic 5.8% |
| Swedes | 8.1 /100 | #215 | Tragic 5.8% |
| Nigerians | 7.5 /100 | #216 | Tragic 5.8% |
| Czechs | 7.4 /100 | #217 | Tragic 5.8% |
| Immigrants | Sierra Leone | 7.1 /100 | #218 | Tragic 5.8% |
| Sierra Leoneans | 7.0 /100 | #219 | Tragic 5.8% |
| Belgians | 6.9 /100 | #220 | Tragic 5.8% |
| Lithuanians | 6.7 /100 | #221 | Tragic 5.8% |
| Immigrants | Sudan | 6.7 /100 | #222 | Tragic 5.8% |
| Alsatians | 6.0 /100 | #223 | Tragic 5.8% |
| Mexicans | 5.7 /100 | #224 | Tragic 5.8% |
| Guamanians/Chamorros | 5.6 /100 | #225 | Tragic 5.8% |
| British West Indians | 5.4 /100 | #226 | Tragic 5.8% |
Demographics Similar to Yakama by Disability Age 5 to 17
In terms of disability age 5 to 17, the demographic groups most similar to Yakama are Senegalese (6.3%, a difference of 0.080%), Celtic (6.3%, a difference of 0.10%), Native/Alaskan (6.3%, a difference of 0.22%), Nonimmigrants (6.3%, a difference of 0.32%), and U.S. Virgin Islander (6.3%, a difference of 0.43%).
| Demographics | Rating | Rank | Disability Age 5 to 17 |
| Spanish Americans | 0.0 /100 | #296 | Tragic 6.2% |
| Immigrants | Bahamas | 0.0 /100 | #297 | Tragic 6.2% |
| Lumbee | 0.0 /100 | #298 | Tragic 6.2% |
| Welsh | 0.0 /100 | #299 | Tragic 6.3% |
| Carpatho Rusyns | 0.0 /100 | #300 | Tragic 6.3% |
| U.S. Virgin Islanders | 0.0 /100 | #301 | Tragic 6.3% |
| Celtics | 0.0 /100 | #302 | Tragic 6.3% |
| Yakama | 0.0 /100 | #303 | Tragic 6.3% |
| Senegalese | 0.0 /100 | #304 | Tragic 6.3% |
| Natives/Alaskans | 0.0 /100 | #305 | Tragic 6.3% |
| Immigrants | Nonimmigrants | 0.0 /100 | #306 | Tragic 6.3% |
| Bahamians | 0.0 /100 | #307 | Tragic 6.3% |
| Scotch-Irish | 0.0 /100 | #308 | Tragic 6.3% |
| Hmong | 0.0 /100 | #309 | Tragic 6.3% |
| Alaskan Athabascans | 0.0 /100 | #310 | Tragic 6.3% |